Analytics & Reports
Track revenue trends, top products, cost of goods, and margin breakdowns.
Overview
Analytics shows how your store is performing. The numbers focus on real sales so you can make daily decisions faster.
Use the tabs at the top to switch between five reports. Use the date range selector to narrow the data to 7, 30, or 90 days.
Selecting a Date Range
The date range tabs appear on every Analytics page — 7 Days, 30 Days, and 90 Days. All metrics and charts update instantly when you switch ranges. The selected range is preserved as you move between tabs.

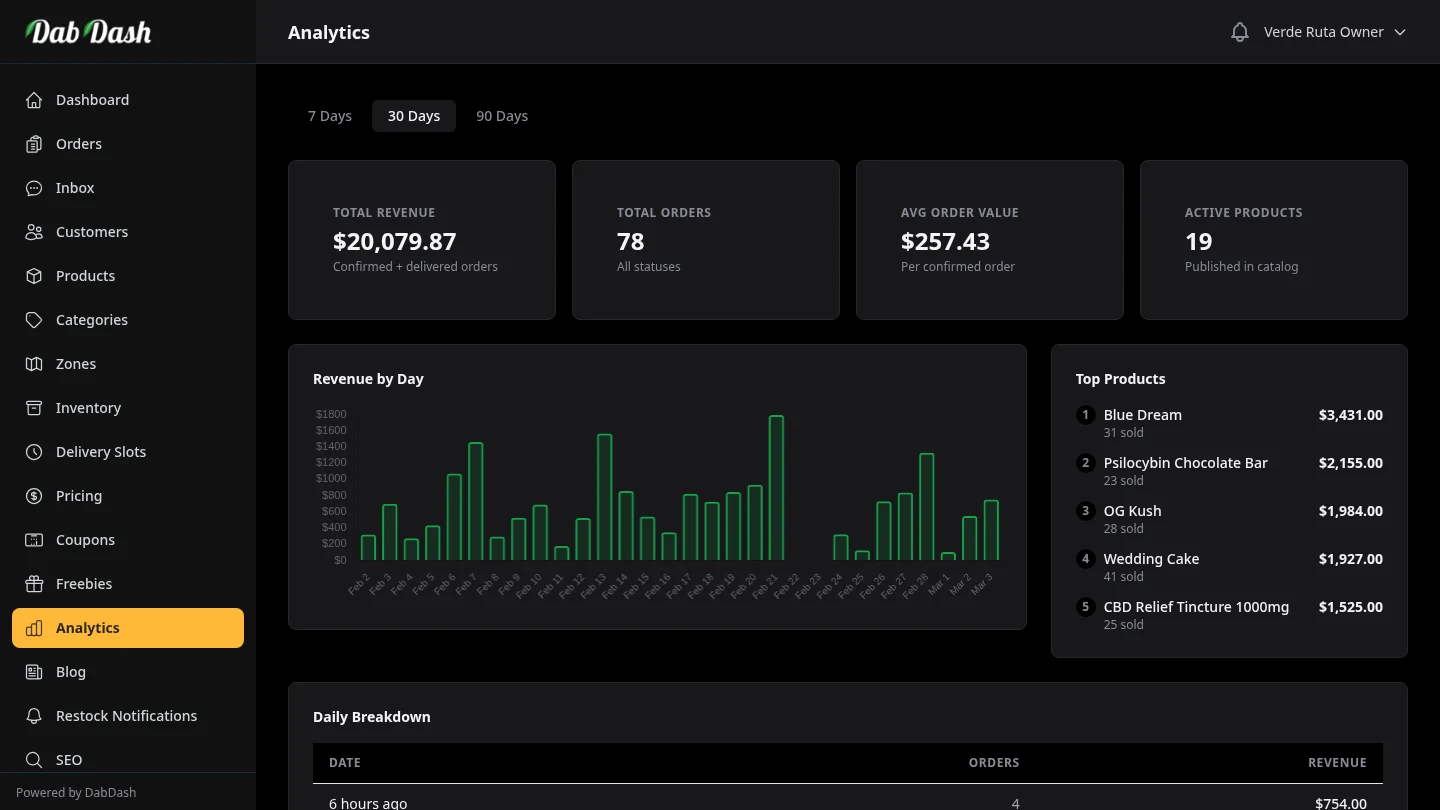
Revenue
The Revenue tab is the main dashboard. Four stat cards at the top give you an instant snapshot:
- Total Revenue
- The sum of all order totals (including delivery fees) for confirmed and delivered orders in the selected period.
- Total Orders
- The number of orders placed in the period, regardless of status — useful for understanding order volume.
- Avg Order Value
- Revenue divided by confirmed order count. A rising average means customers are spending more per visit.
- Active Products
- How many products are currently published in your catalogue.
Below the cards, a bar chart shows daily revenue over the selected period. The orders-by-day table beneath the chart lists each day with its order count and total revenue for quick reference.
By Product

The By Product report ranks every product by revenue for the selected period. Use this to identify your best sellers and your slowest movers.
- Revenue
- Total revenue generated by that product across all orders in the period.
- Units Sold
- Total quantity sold — for weight-tracked products this shows grams.
- Orders
- How many distinct orders included this product.
By Zone

The By Zone report shows which delivery zones are generating the most revenue and order volume. Use this to identify high-value areas for marketing, or to decide whether a low-performing zone is worth keeping active.
Cost of Goods (COGS)

The COGS report shows product profit. COGS means your product cost. To use this report, make sure each product has a Cost Price.
- Revenue
- What customers paid for this product in the period.
- Total Cost
- Units sold × cost price. Represents what you paid to acquire or produce the goods sold.
- Gross Profit
- Revenue minus cost. This is the money left over before overheads.
- Margin %
- Gross profit as a percentage of revenue. A higher percentage means more of each dollar sold stays with your business.
Inventory Value
The Inventory Value tab shows the current on-hand value of your stock at cost price. Unlike revenue reports, this is a snapshot of what your current stock is worth.
- Total Inventory Value
- Sum of stock quantity × cost price across in-stock products and variations.
- Products In Stock
- Count of products currently carrying positive stock quantity.
- Missing Cost Prices
- Products with stock but no cost configured. These understate your total valuation.
- Avg Cost per Unit
- Aggregate cost baseline used for quick purchasing and replenishment decisions.
You can search and sort this table. Use it before placing purchase orders or doing end-of-month checks.
Tips
- Use the 7-day range for daily operations and the 30-day range for weekly reviews. The 90-day range is best for spotting seasonal trends.
- Check the By Product report weekly to identify which items are slow-moving — consider running a promotion or reducing order quantities on the next purchase.
- Enter cost prices on all products so the COGS report can show true profit.
- A consistently low average order value is a signal to review your freebie rules or minimum order thresholds — incentivise customers to add one more item to the cart.