Analytics & Reports
Revenue trends, top products, cost of goods, and margin breakdowns.
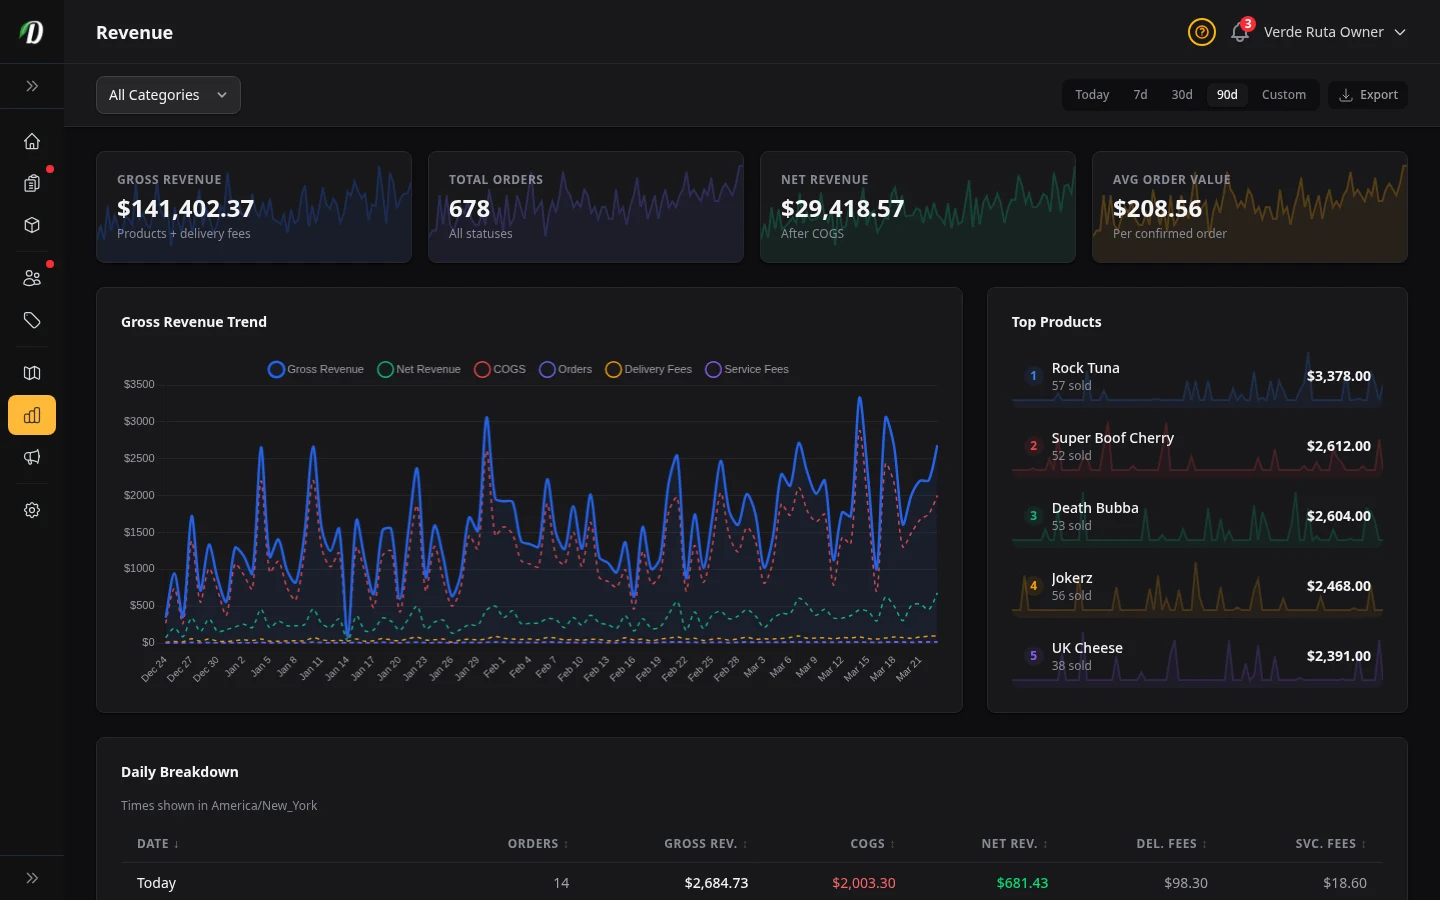
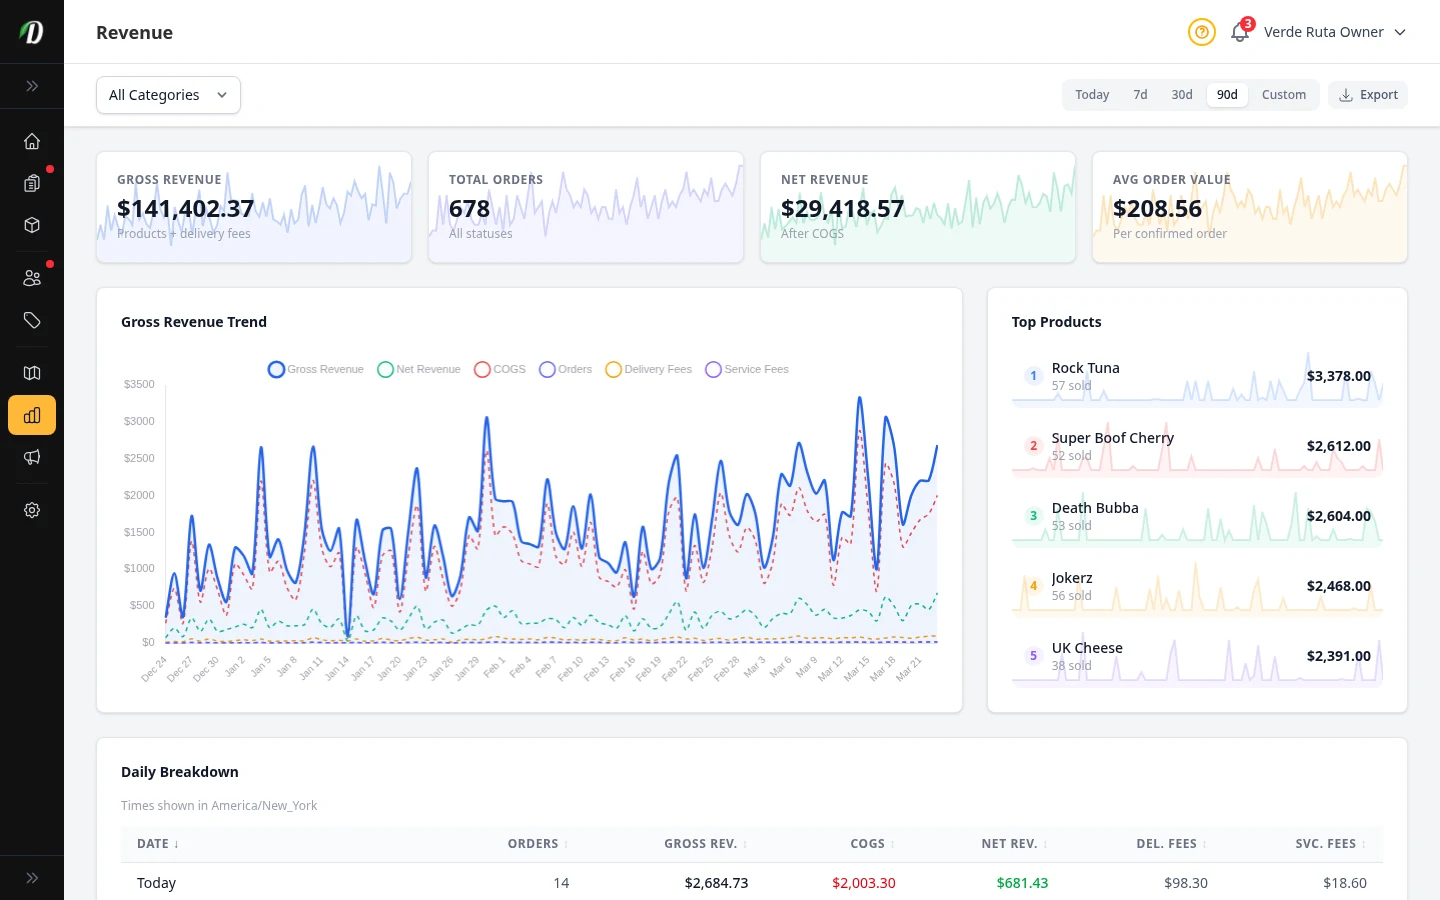
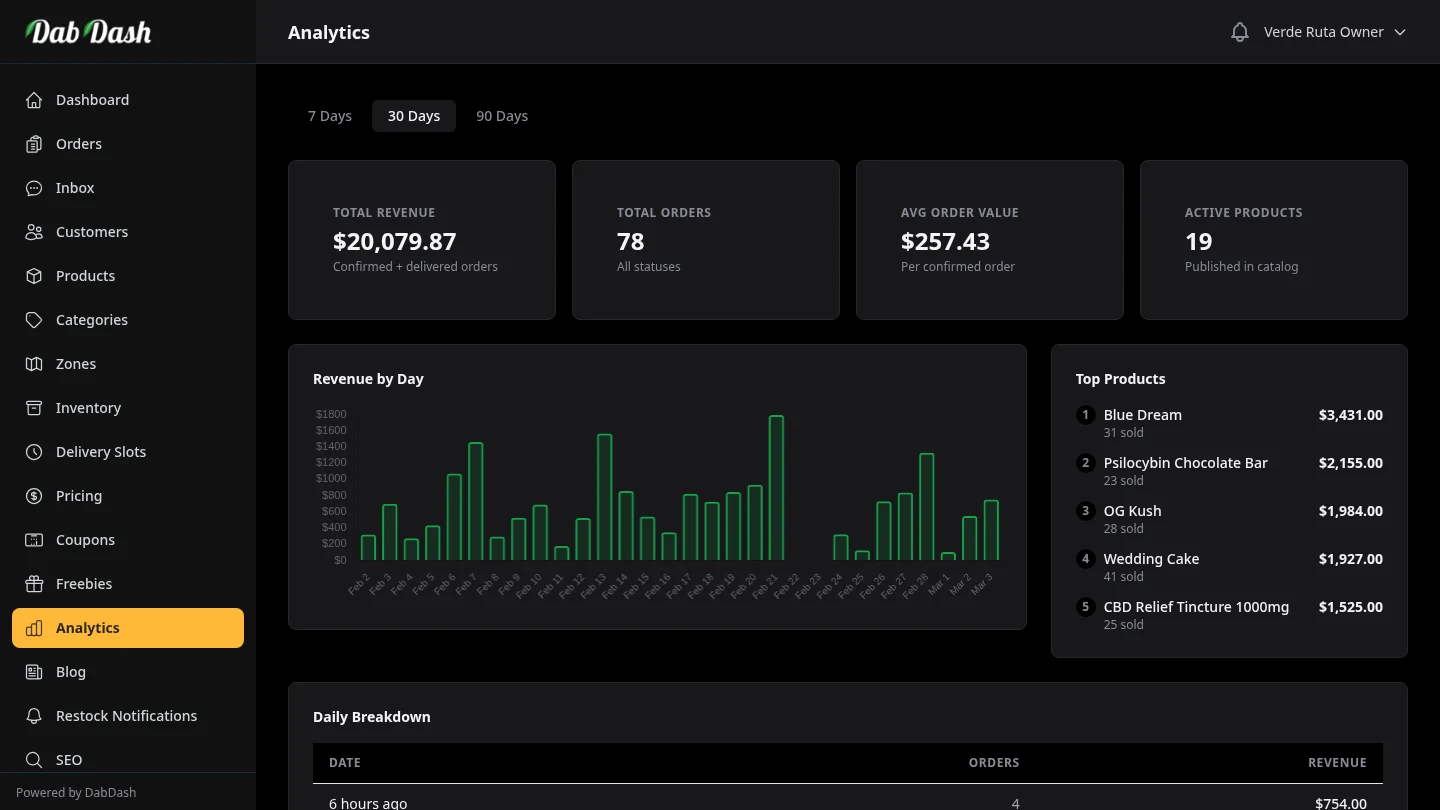
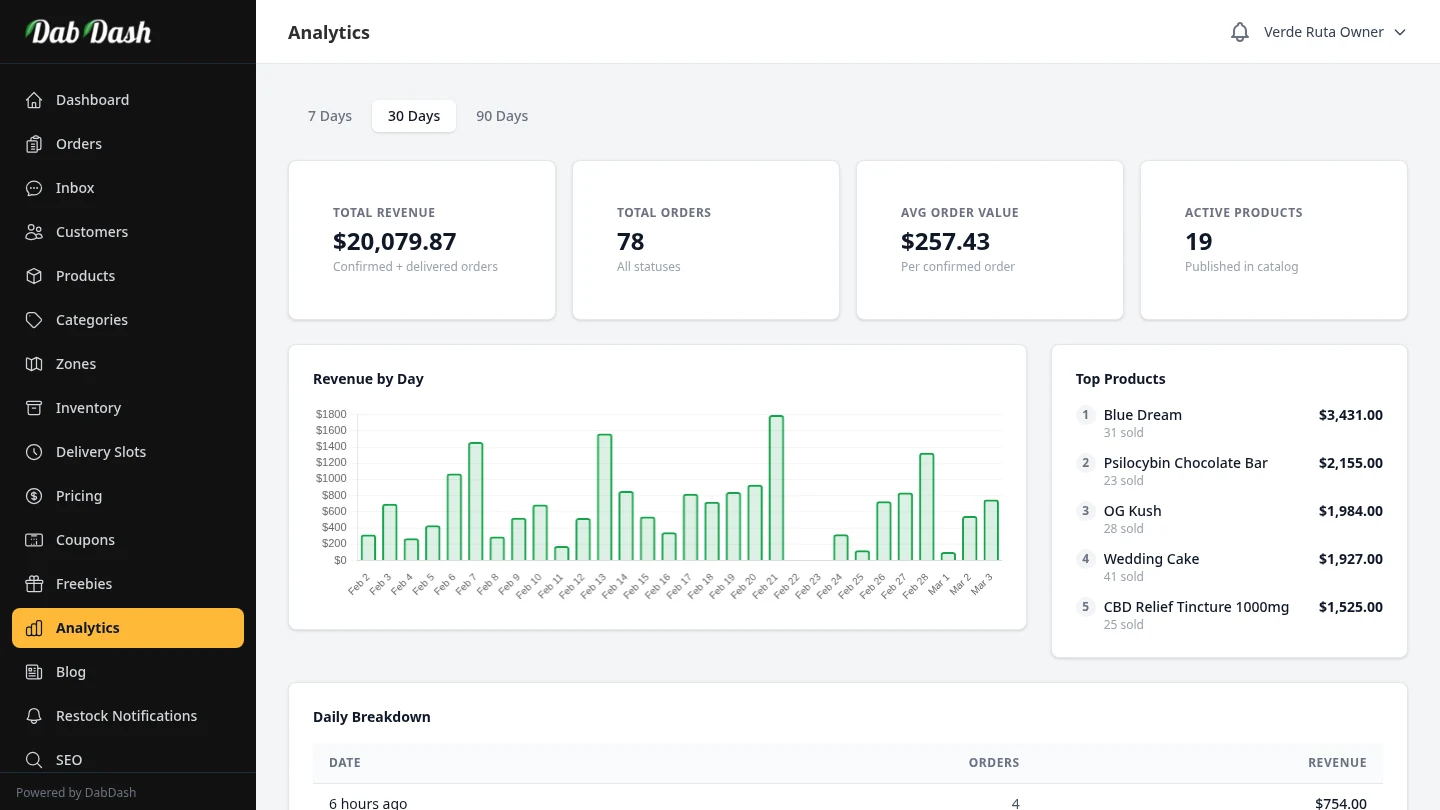
Revenue Overview
Track gross and net revenue, order counts, and average order value with trend charts and daily breakdowns.
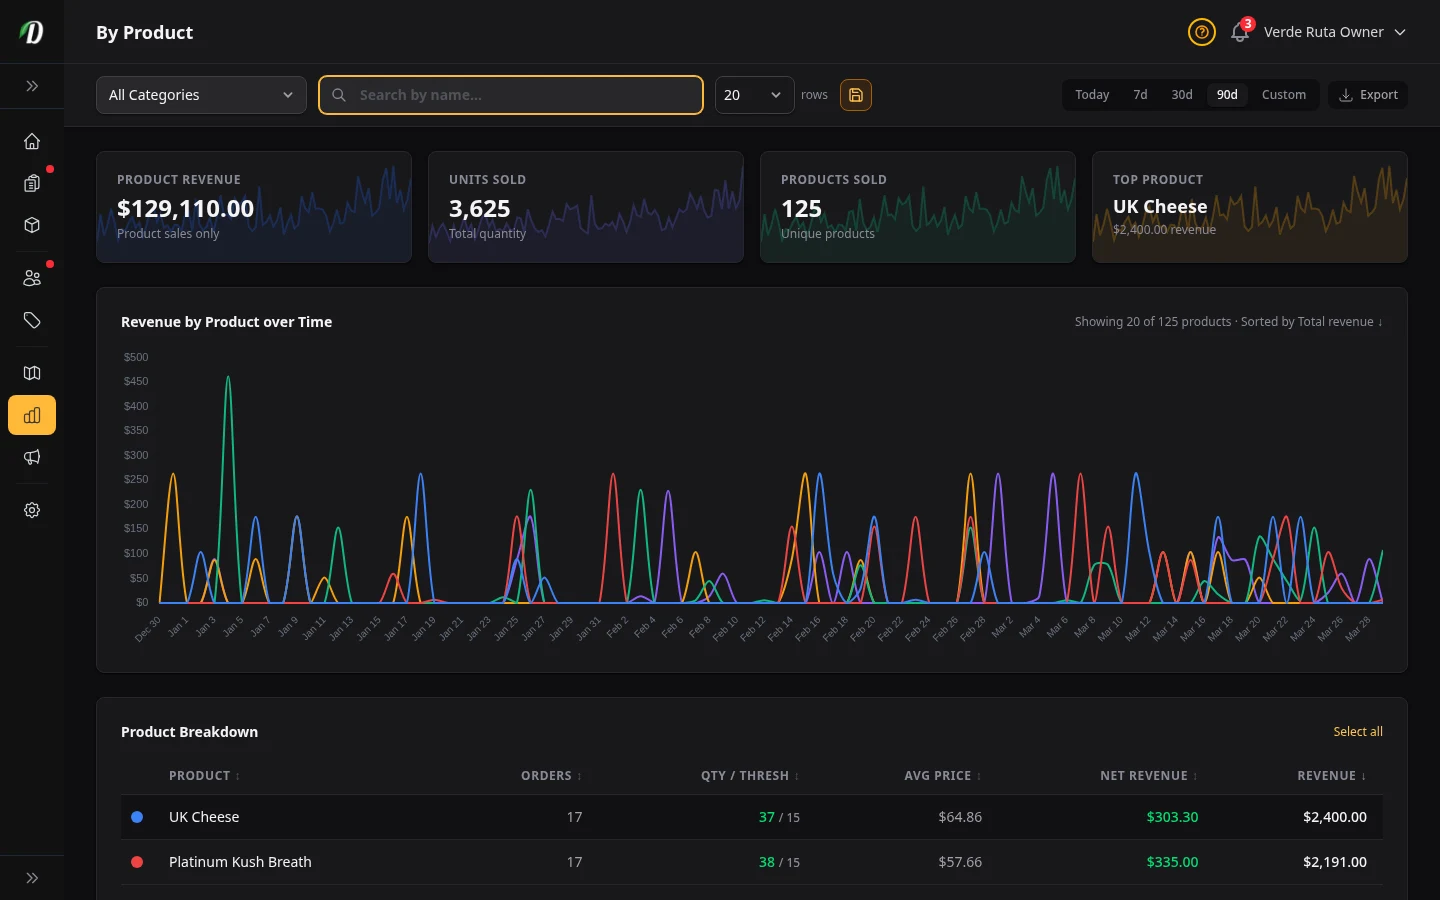
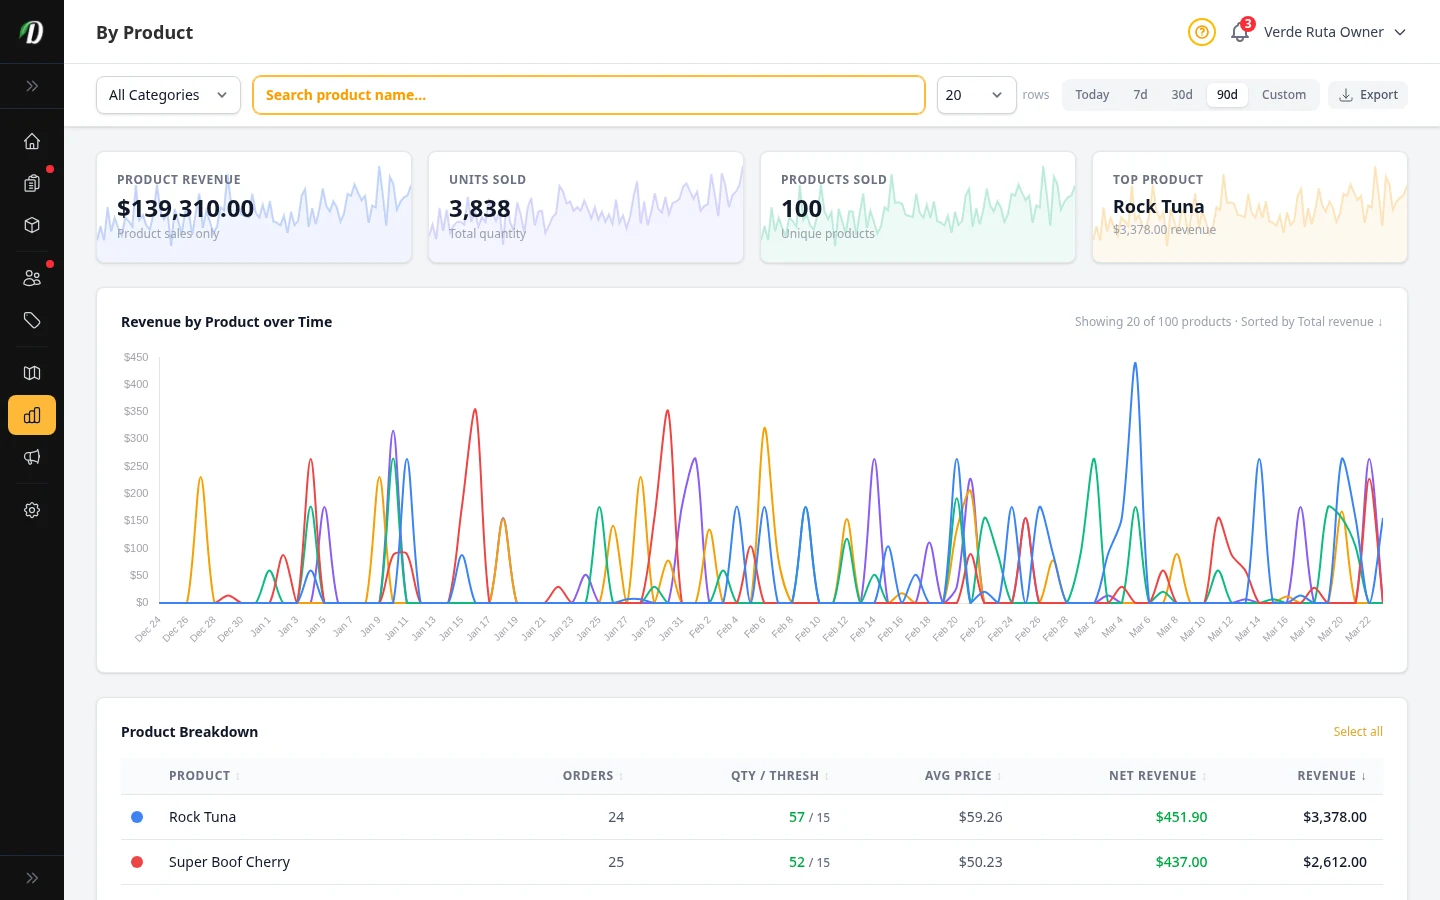
Revenue by Product
Rank products by revenue, track units sold, monitor stock levels, and identify your best sellers.
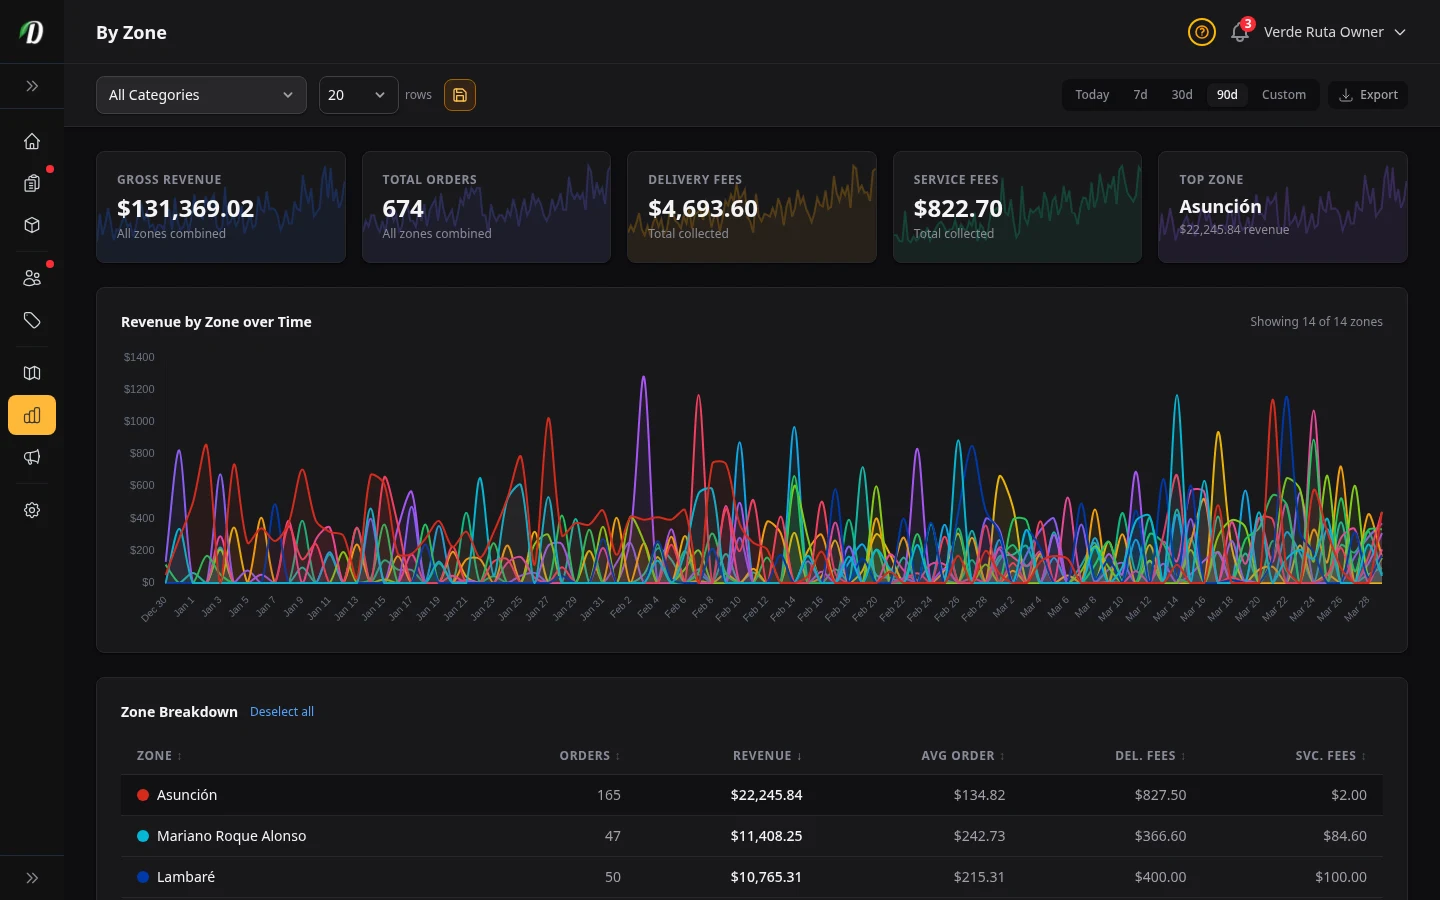
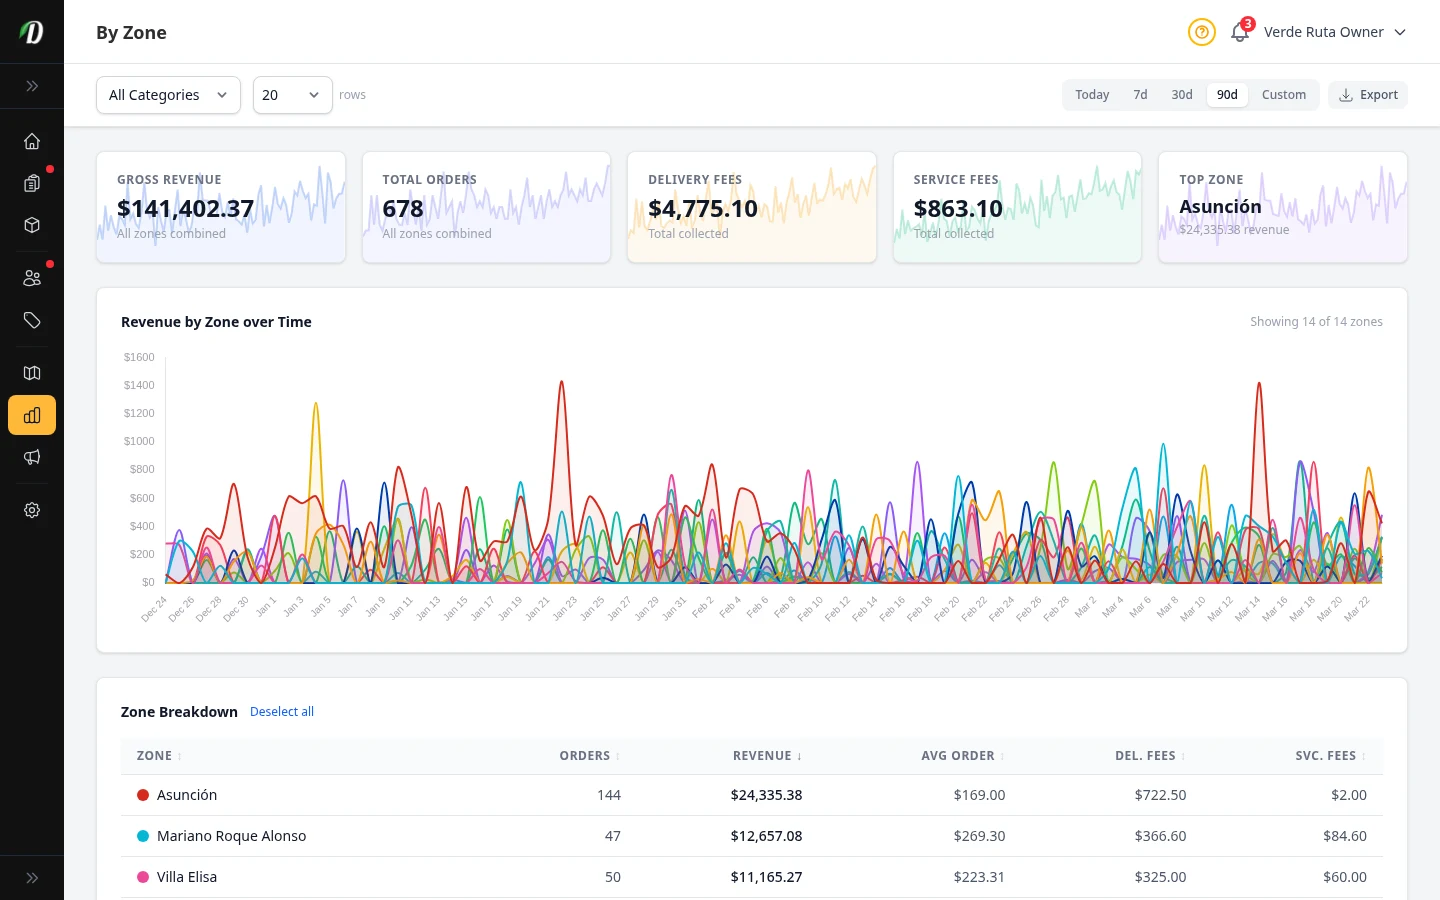
Revenue by Zone
Compare delivery zone performance by revenue, order volume, and delivery fees collected.
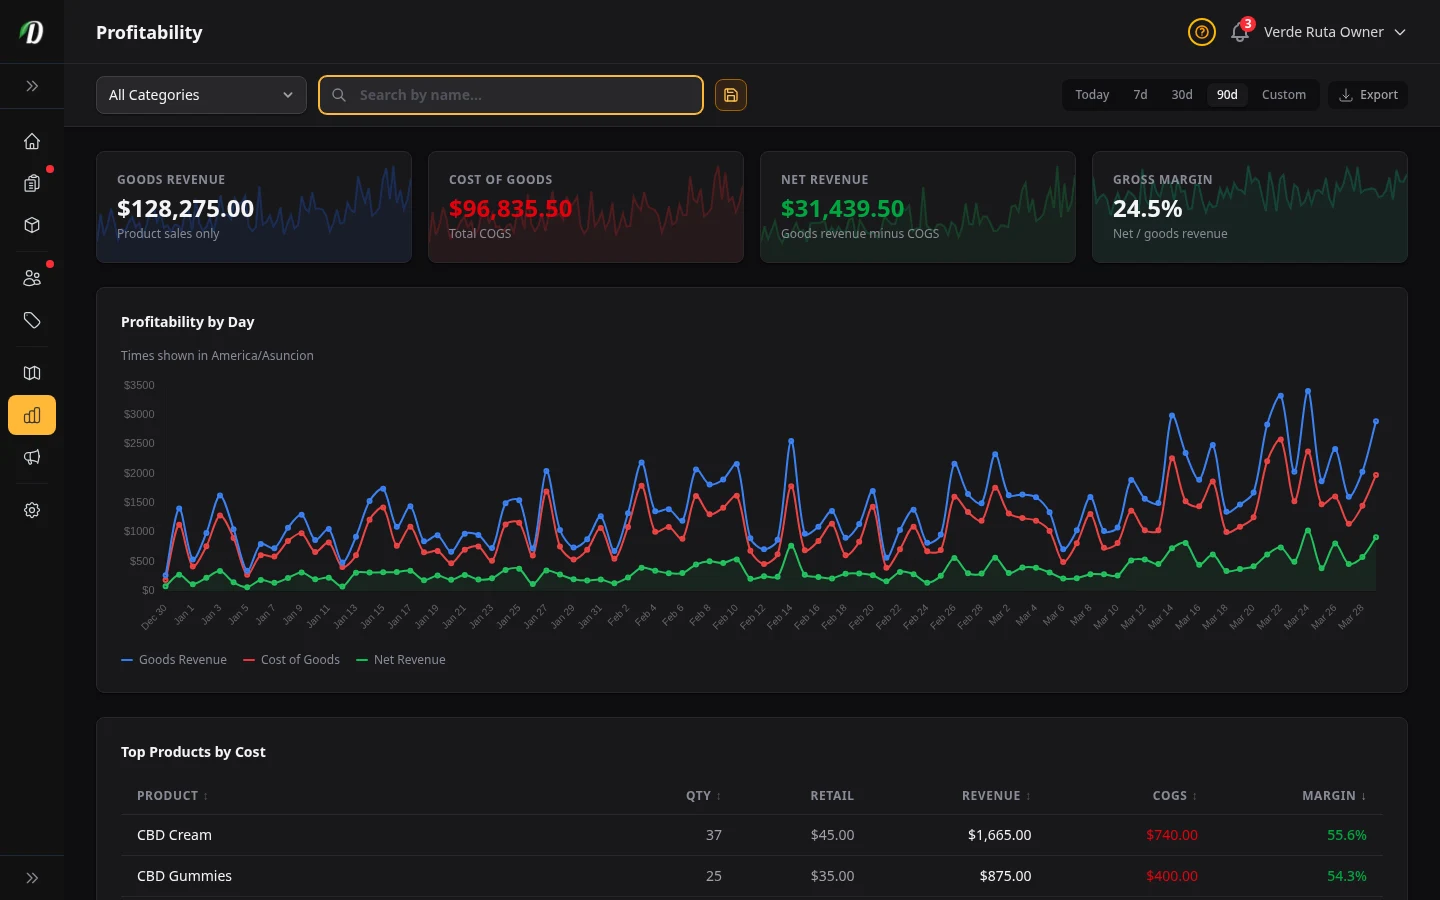
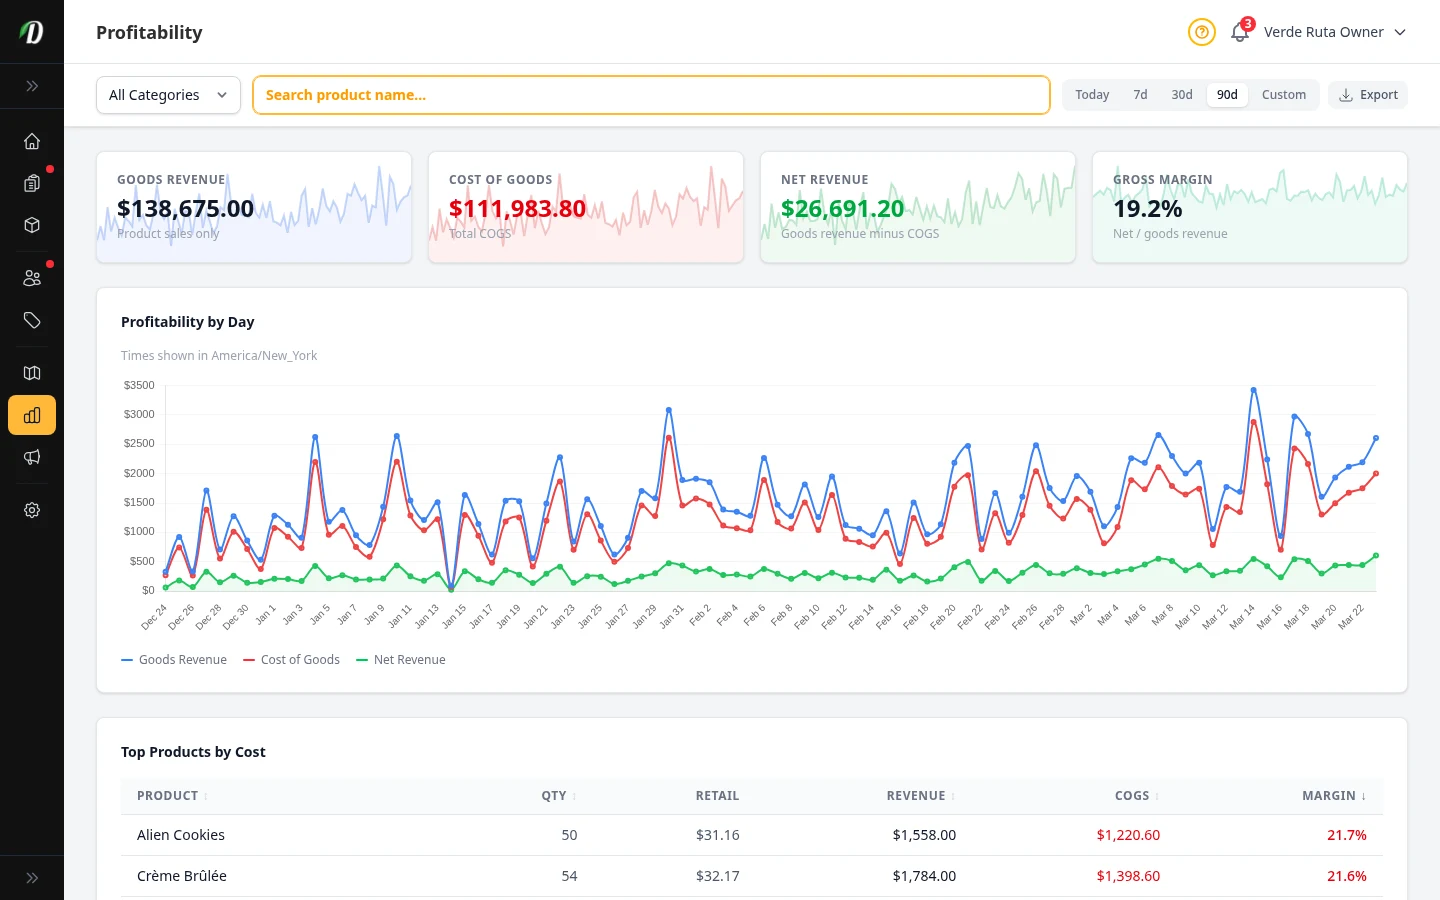
Profitability & COGS
Analyze cost of goods sold, gross margins, and net revenue per product to understand true profit.
Inventory Valuation
See the real-time value of your current stock at cost and retail price with unit conversion and stock distribution.
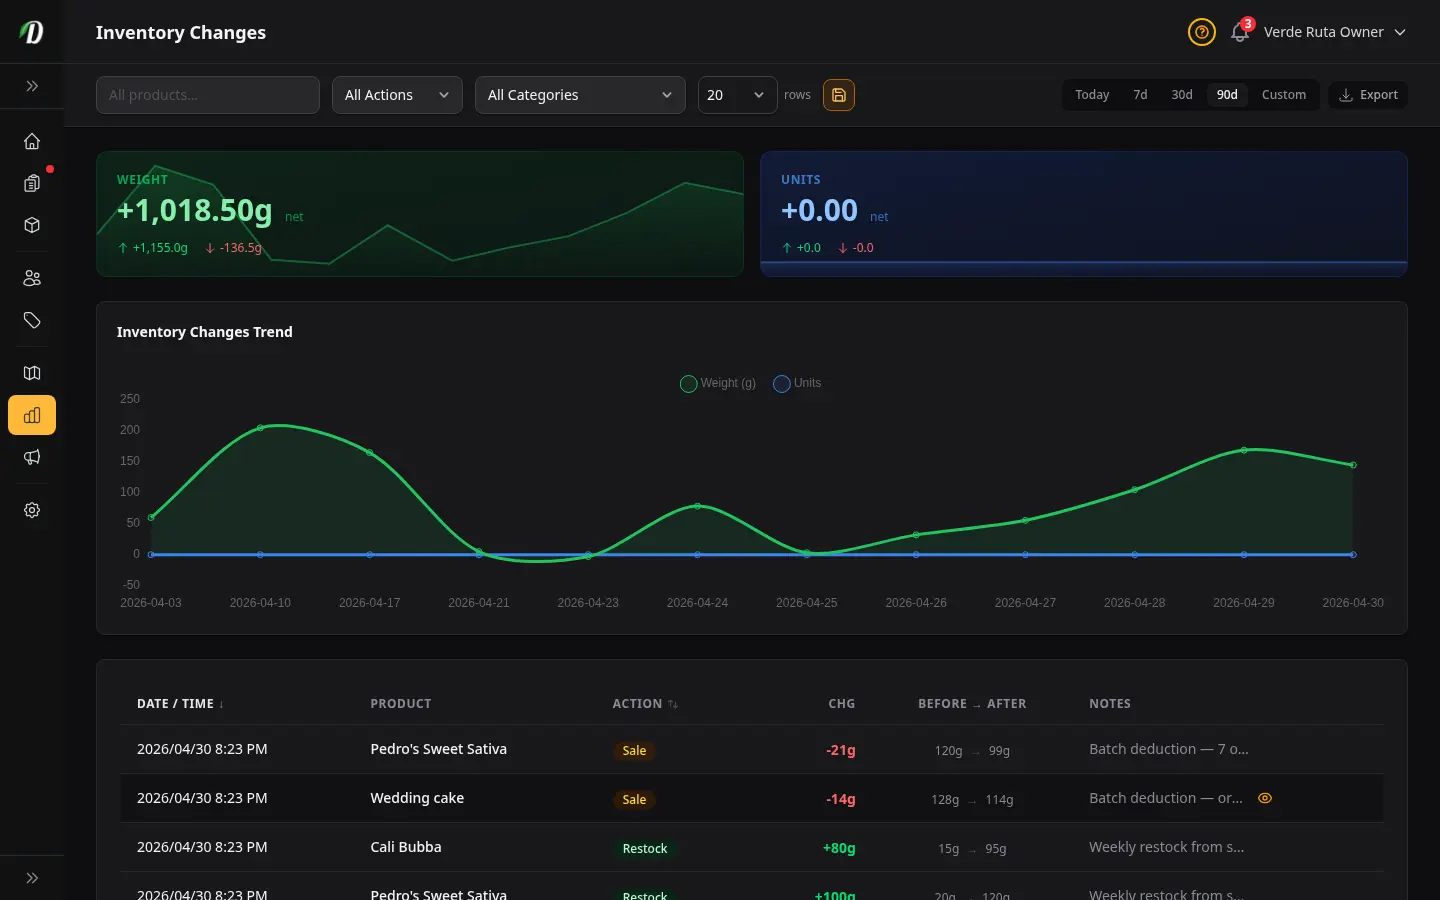
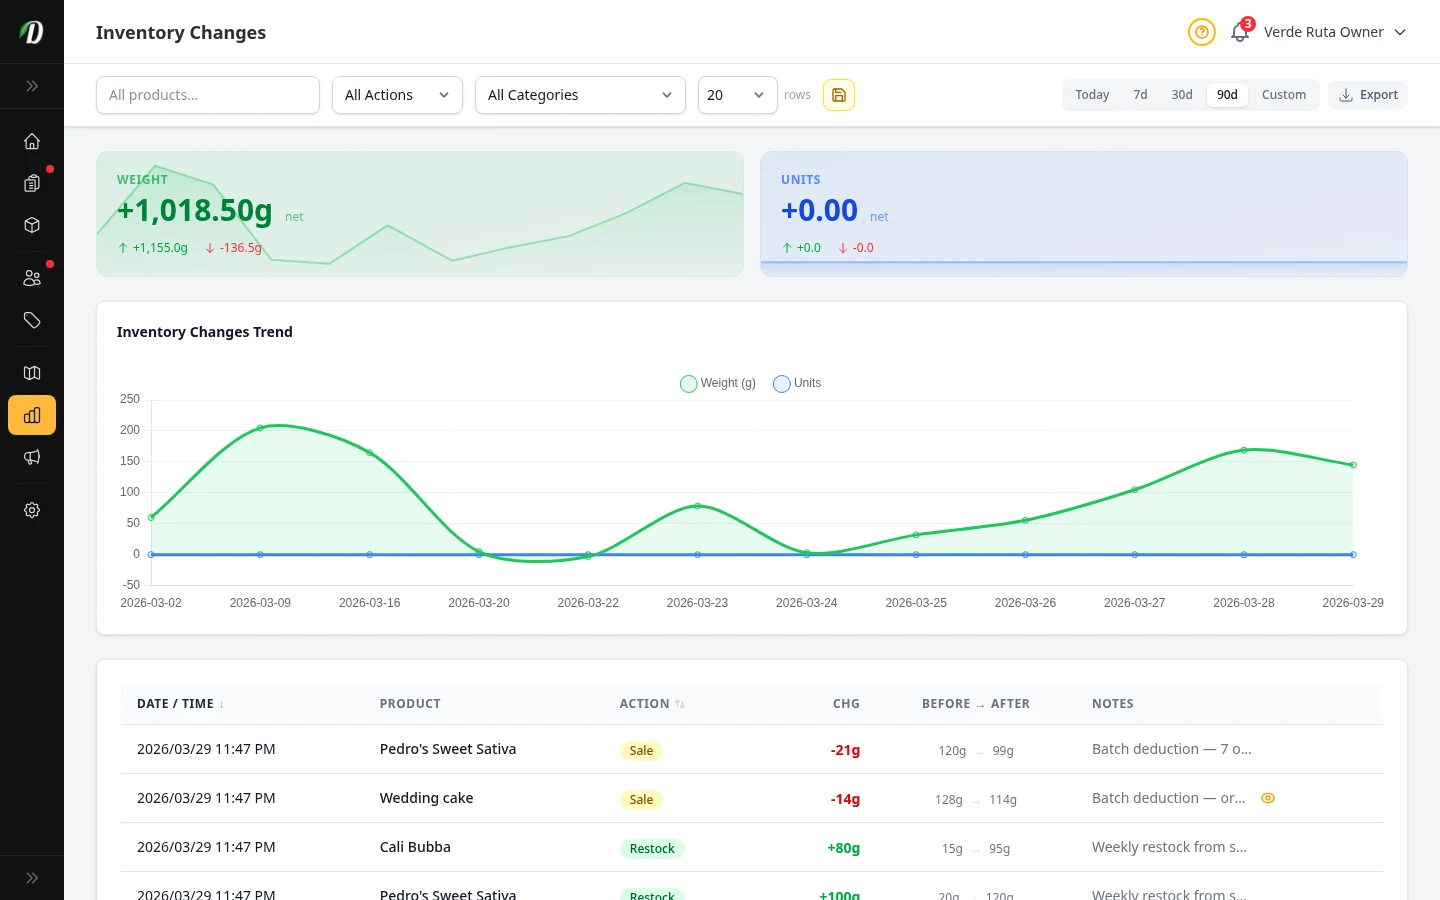
Inventory Changes Report
Audit every stock movement — sales, restocks, manual adjustments, and refunds — with trend charts, stat cards, and full-history filtering.
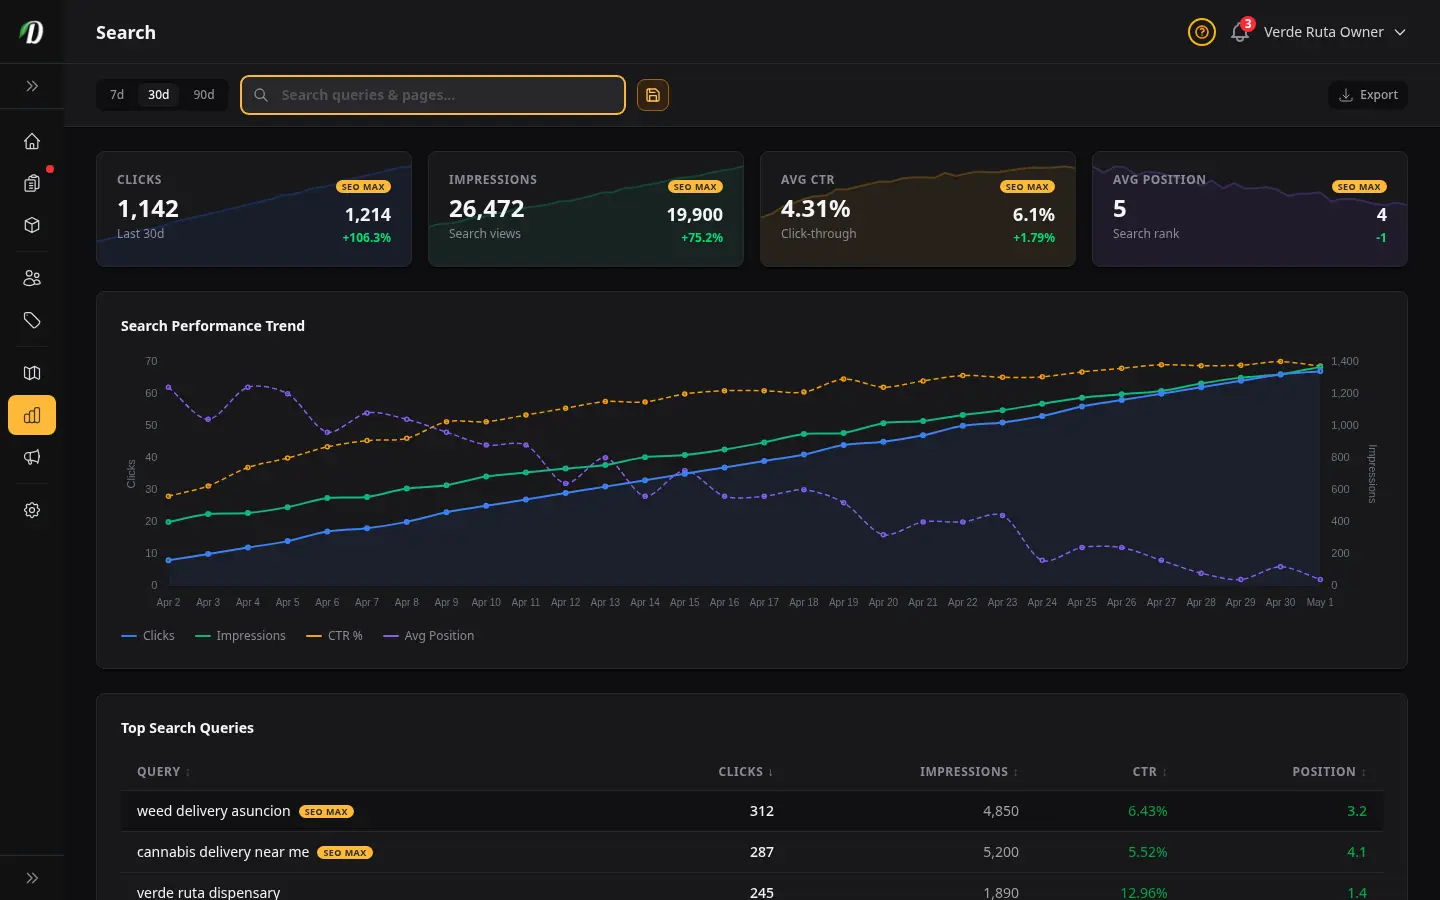
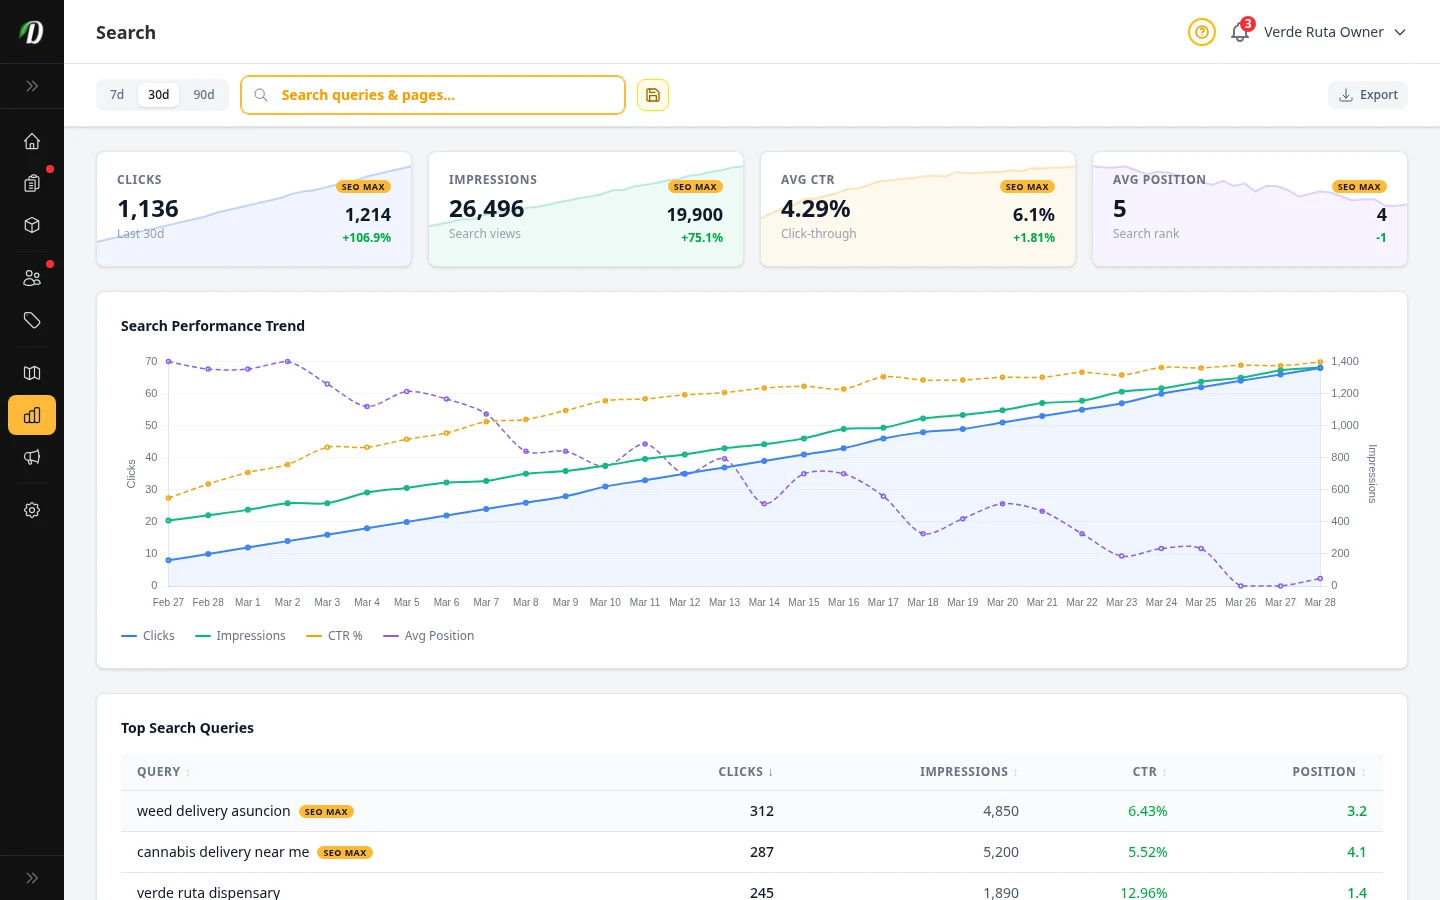
Search SEO MAX
Track search clicks, impressions, click-through rate, and average position with Google Search Console data.
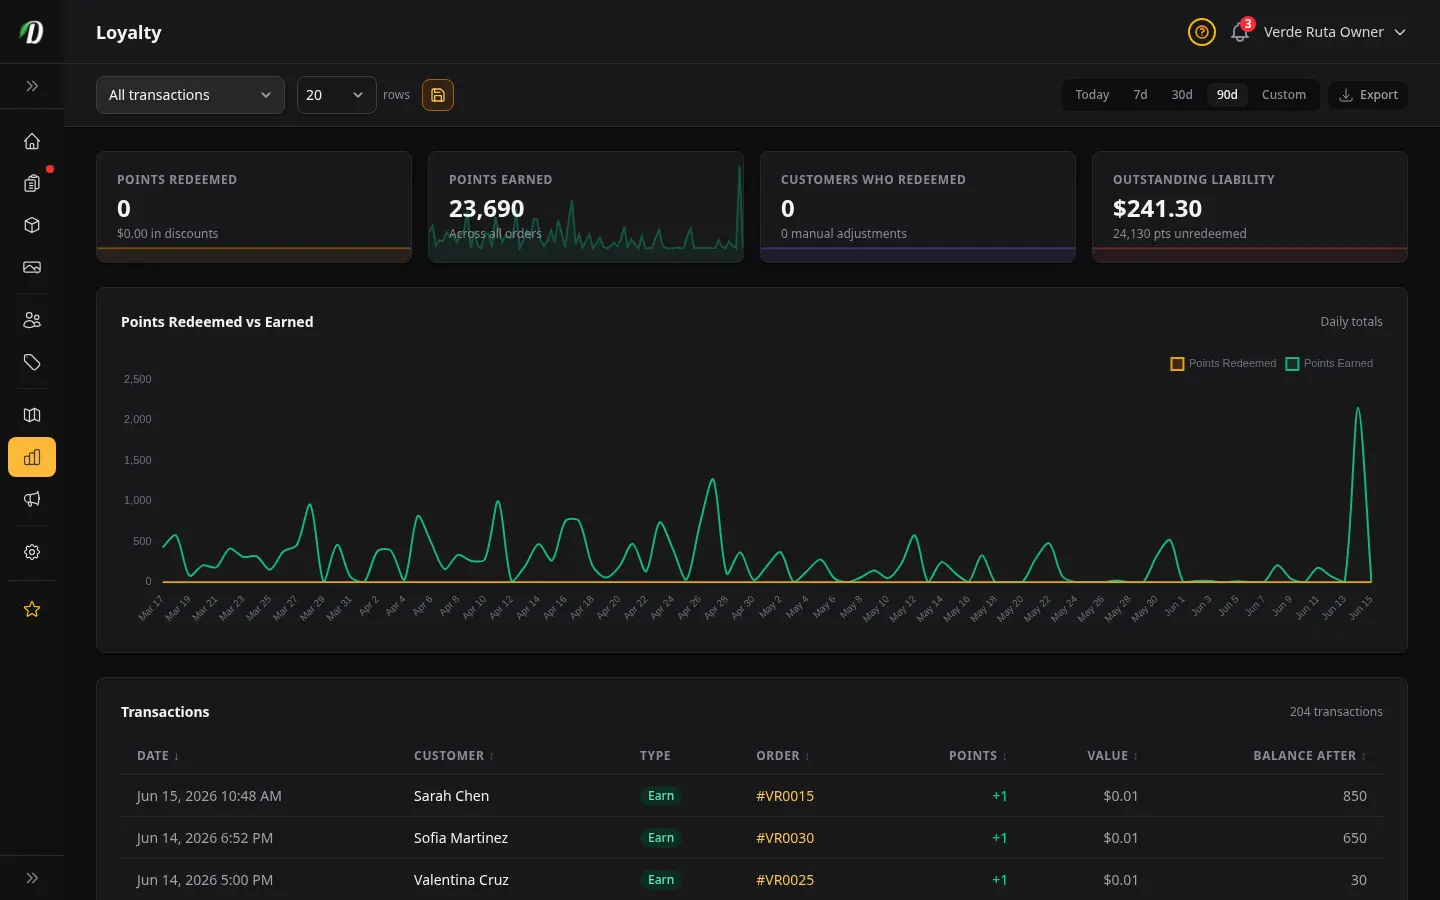
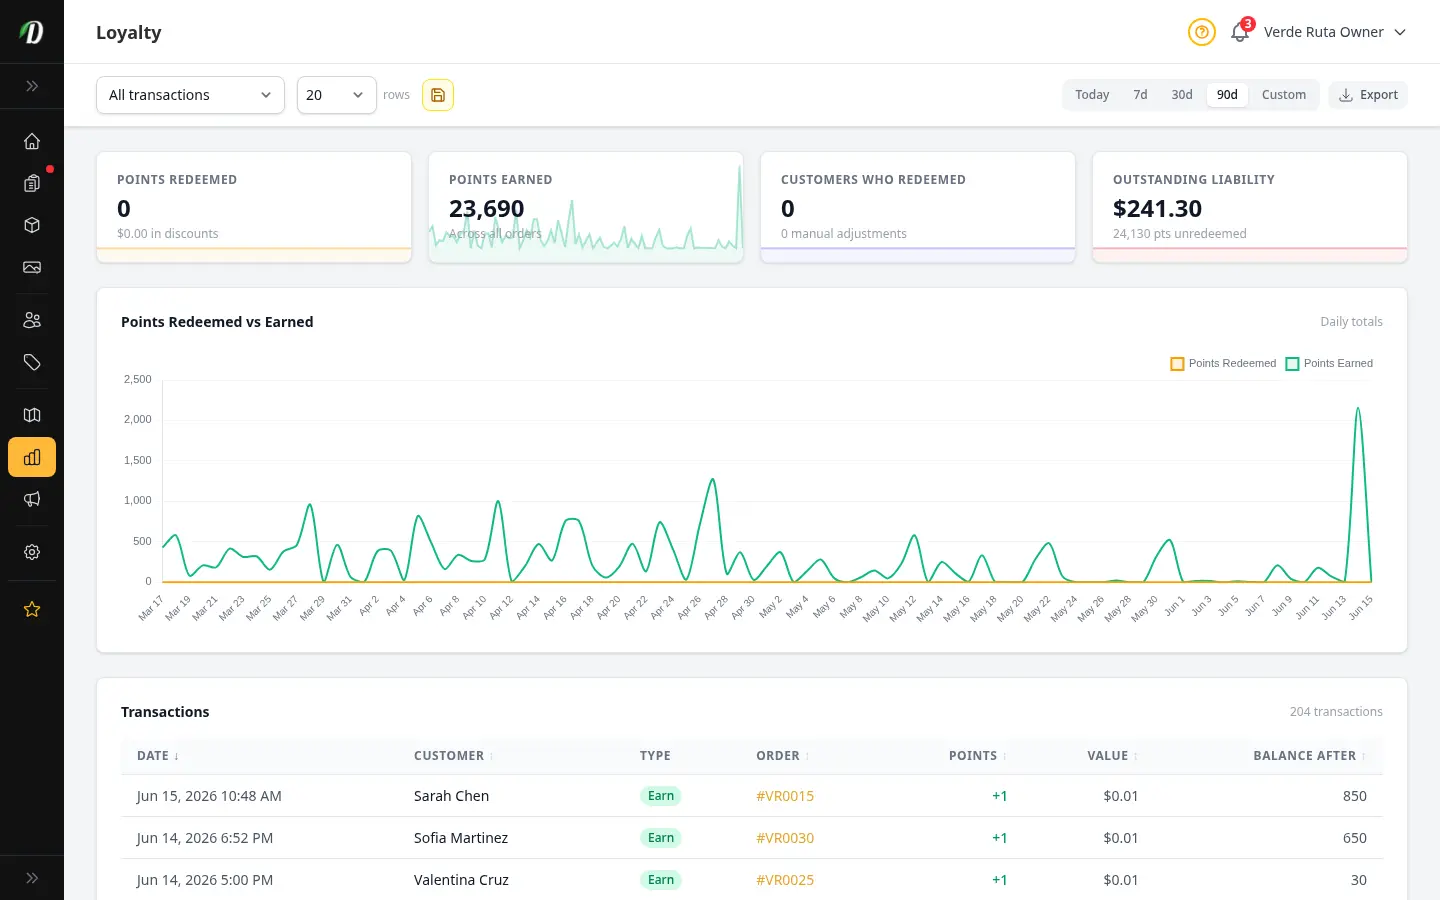
Loyalty Points Report
See points earned and redeemed over time, your outstanding points liability in dollars, who is redeeming, and a full searchable transaction ledger you can export.
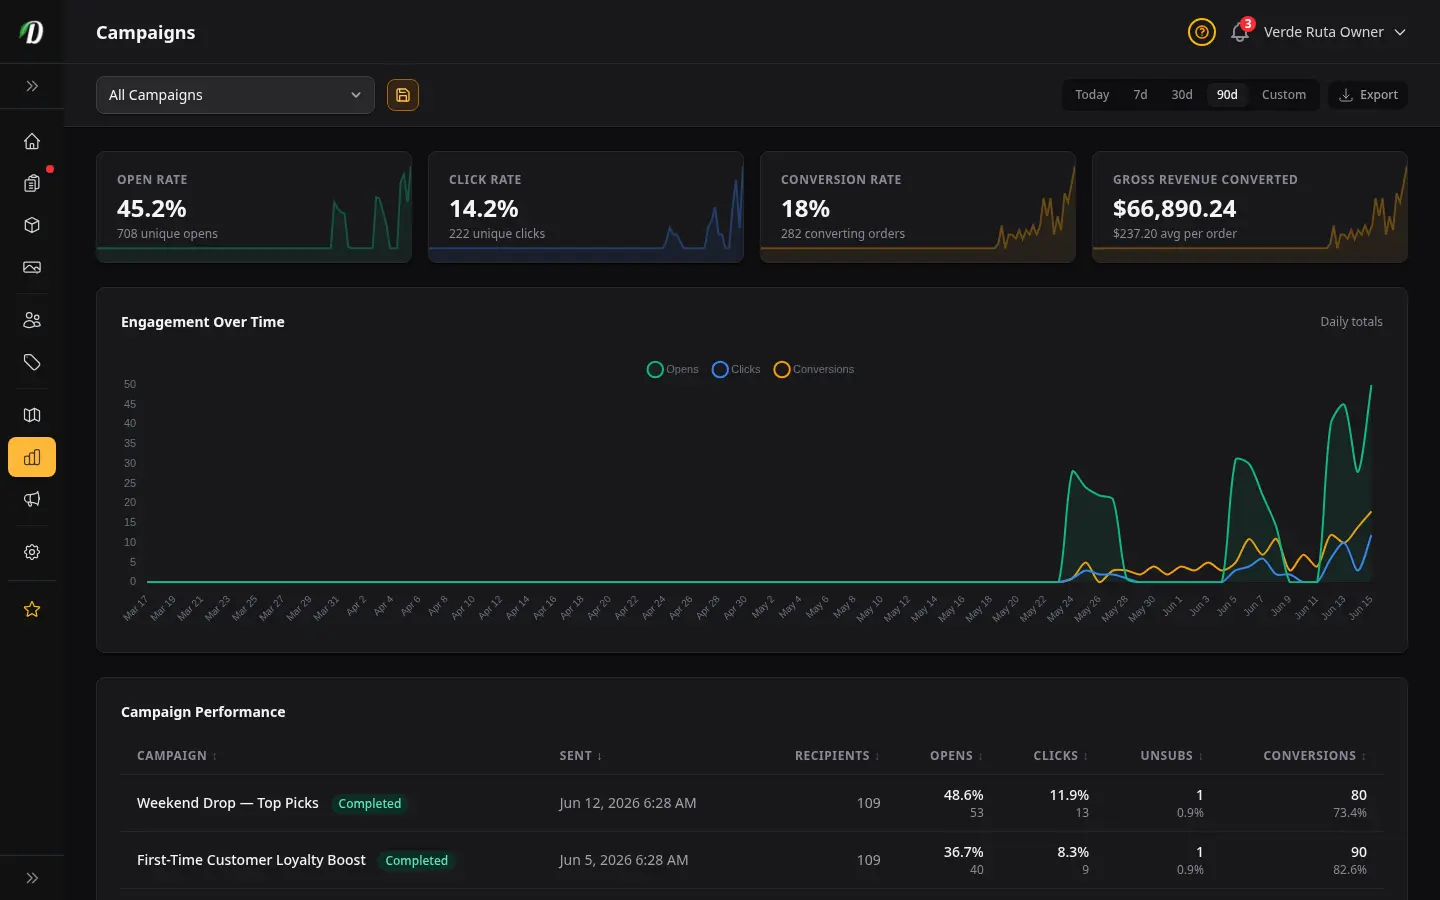
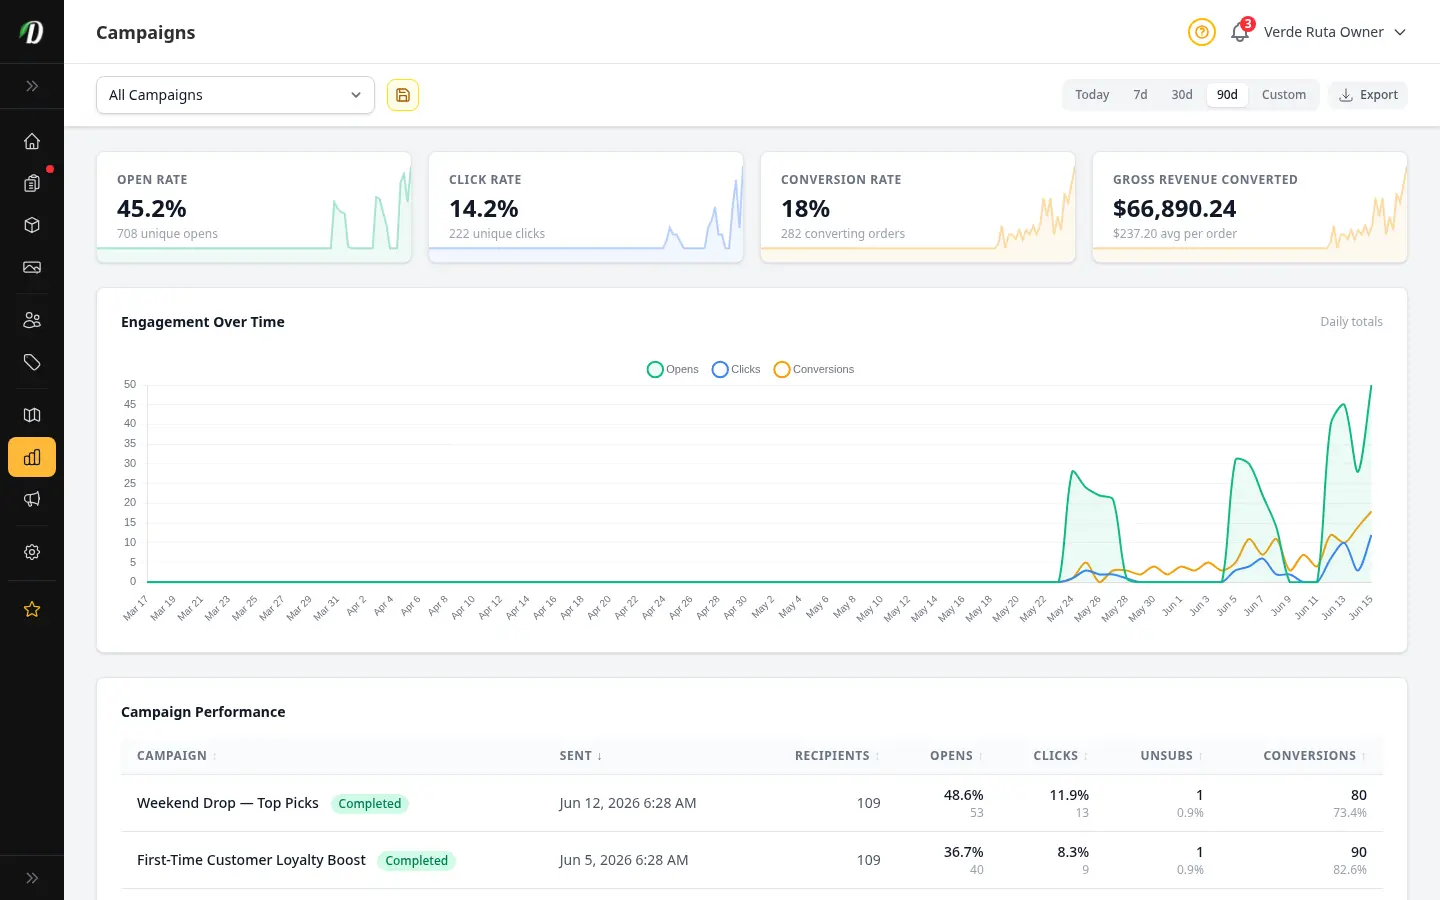
Campaign Analytics
Measure every email campaign — sends, open rate, click rate, unsubscribes, conversions, and revenue — with an engagement chart and a per-campaign drill-down showing recipients, top links, and the 72-hour engagement timeline.