Inventory Changes Report
Audit every stock movement — sales, restocks, manual adjustments, and refunds — with trend charts, stat cards, and full-history filtering.
Overview
The Inventory Changes report is a complete audit trail of every stock movement in your store. Every sale, refund, manual adjustment, restock, and bulk change is recorded with an exact timestamp, before/after quantity snapshot, and a link back to the originating order.
Use this report to reconcile discrepancies, investigate unexpected stock drops, verify restocks were applied correctly, or review how inventory flowed during a busy period.
Tip: This report is separate from the Inventory Valuation tab. Valuation shows your current stock worth; Inventory Changes shows the history of how that stock moved.
Filters
The filter bar at the top lets you narrow the report to exactly the movements you need.
- Date Range
- Use the 7 Day, 30 Day, or 90 Day presets, or pick a custom from/to range. All stat cards, the trend chart, and the change log table update instantly.
- Product
- Type a product name in the search box. An autocomplete dropdown shows matching products. Select one to filter every element on the page to that product only. Click the ✕ to clear and return to all products.
- Action
- Filter by movement type: Add, Deduct, Set, Order, Refund, Restock, Sale, or Adjustment. Useful when you want to see only order-driven deductions or only manual restocks.
- Category
- Filter to products in a specific category. Combine with the action filter to narrow further — for example, all Order deductions in the Flower category.
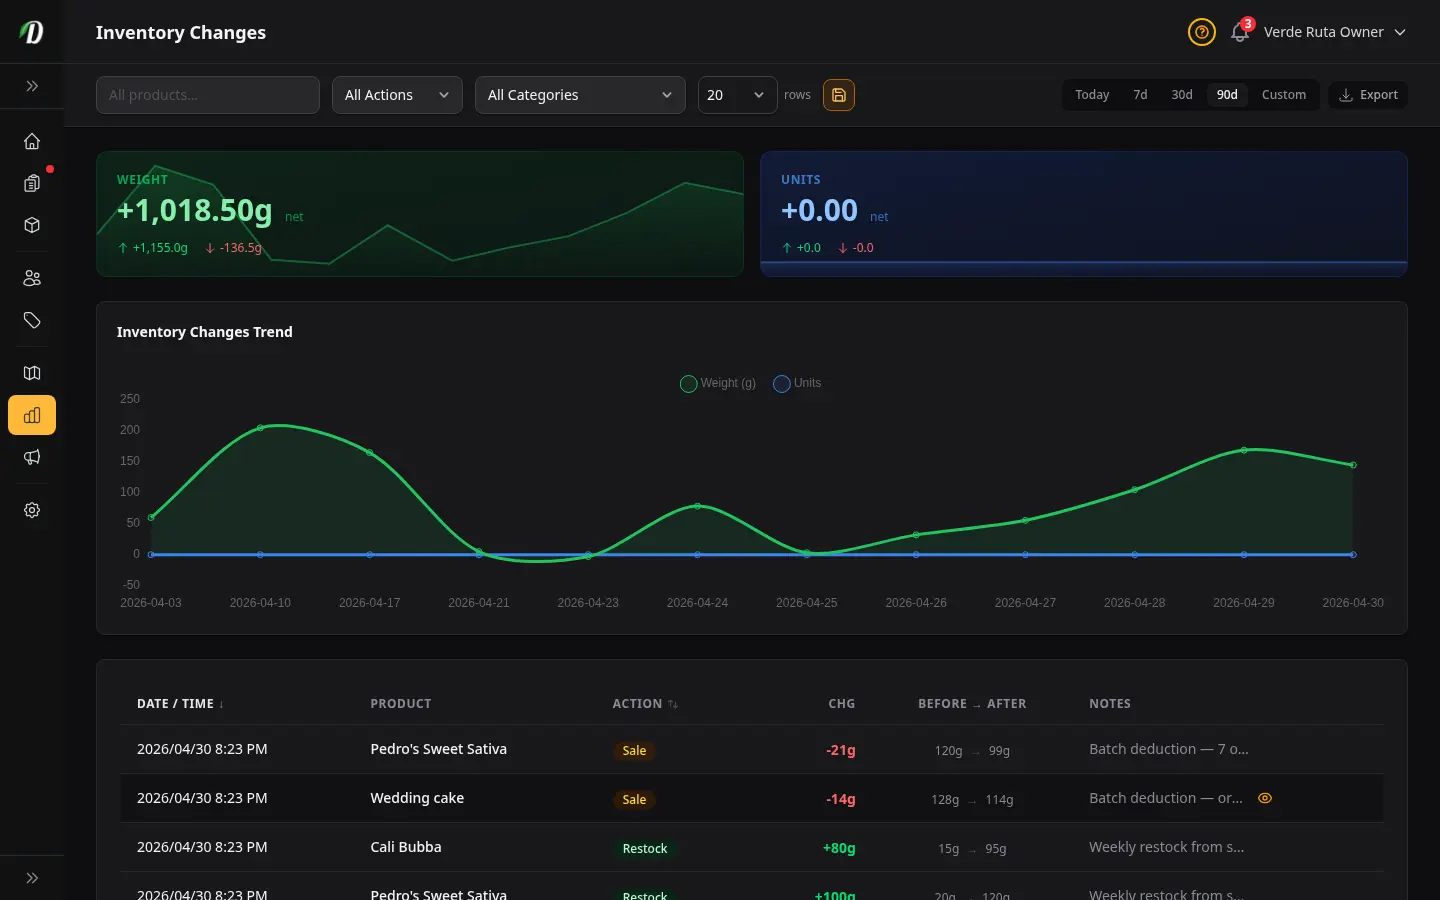
Stat Cards
Two summary cards appear at the top of the report — one for each inventory family. They reflect the current filter and date range.
- Weight (green card)
- Net gram change across all weight-tracked products (flower, hash, concentrates). A positive number means more grams were added than removed. The sparkline shows the 14-day movement trend. Below the net number: total grams added and total grams deducted.
- Units (blue card)
- Net unit change across all unit-tracked products (edibles, pre-rolls, capsules, accessories). Same layout as the weight card. A card only appears when the current filter includes products of that family.
Color convention: Green = weight family (weight + matrix pricing). Blue = unit family (simple, unit, matrix unit). This matches the color scheme throughout DabDash analytics.
Inventory Changes Trend Chart
The line chart plots daily net inventory change over the selected date range. Each day shows how much stock moved for weight-tracked and unit-tracked products separately.
- Weight (g) series — green line
- Daily net grams moved. Spikes upward on restock days, dips downward on high-volume sales days.
- Units series — blue line
- Daily net unit count moved. Same direction convention as the weight series.
Hover any point to see the exact value for that day. The chart only appears when there is at least one data point in the selected range.
Change Log Table
The paginated table shows every stock movement in reverse chronological order. Click the Date / Time or Action column headers to change sort order.
| Column | What it shows |
|---|---|
| Date / Time | Timestamp of the change in your store's timezone. Hidden on small screens. |
| Product | Name of the product whose stock changed. |
| Action | Coloured badge showing the type of movement. Hidden on small screens — see action badge reference below. |
| Chg (Change) | Signed quantity change. Green = stock increased. Red = stock decreased. Weight products append g. |
| Before → After | Stock quantity immediately before and after the movement. Hidden on small screens. |
| Notes | Free-text note added at the time of adjustment. Order-linked rows show a view icon — click to open the related order. Hidden on small screens. |
Action Badge Reference
| Badge | When it appears | Stock effect |
|---|---|---|
| Add | Stock manually increased | Positive |
| Deduct | Stock manually decreased | Negative |
| Set | Stock set to an exact number | May be positive or negative |
| Order | Order confirmed, stock deducted | Negative — links to order |
| Refund | Order cancelled or reversed, stock returned | Positive — links to order |
| Restock | Bulk restock event applied | Positive |
| Sale | Batch order deduction (multiple orders flushed together) | Negative |
| Adjustment | Custom correction with note | May be positive or negative |
Tips
- Filter by action Order to see a clean list of all customer-driven stock deductions for the period.
- Filter by a product and set a wide date range to see its complete stock history since tracking began.
- A large Set entry that resets stock to zero may indicate an accidental bulk update — check the Notes column for context.
- Use Refund entries to verify stock was correctly returned when orders were cancelled or reversed.
- Export the report as CSV before month-end for reconciliation with your purchase records.
Frequently Asked Questions
What does the DabDash Inventory Changes report show?
The Inventory Changes report shows every stock movement in your store — orders, refunds, manual adjustments, restocks, and sales — as a time-ordered list. Two stat cards show net weight change (grams) and net unit change for the selected period, with a trend chart plotting daily movement over time.
How do I filter the DabDash Inventory Changes report by product?
Use the product search box at the top of the Inventory Changes page. Start typing a product name and select from the autocomplete dropdown. The stat cards, chart, and table all filter to show only that product's history. Click the ✕ to clear the filter and show all products again.
What do the action badges mean in DabDash inventory changes?
Each row shows a coloured badge for the type of stock movement: Add (green) when stock is manually increased, Deduct (red) when manually decreased, Set (grey) when stock is set to an exact number, Order (amber) when an order deducts stock, Refund (green) when a cancelled order returns stock, Restock (green) for bulk restock events, Sale (amber) when multiple orders are deducted together in a batch, and Adjustment (grey) for custom corrections.
How do I see which order caused a stock change in DabDash?
When a stock movement is linked to an order, the Notes column shows a view icon (eye). Click it to open the order detail directly. Order-linked rows have the action badge set to Order or Refund.
Can I export the DabDash Inventory Changes report?
Yes — click the Export button in the analytics filter bar to download the currently filtered inventory changes as a CSV file. All active filters (date range, product, action type, category) are applied to the export.