Revenue by Product
Rank products by revenue, track units sold, monitor stock levels, and identify your best sellers.
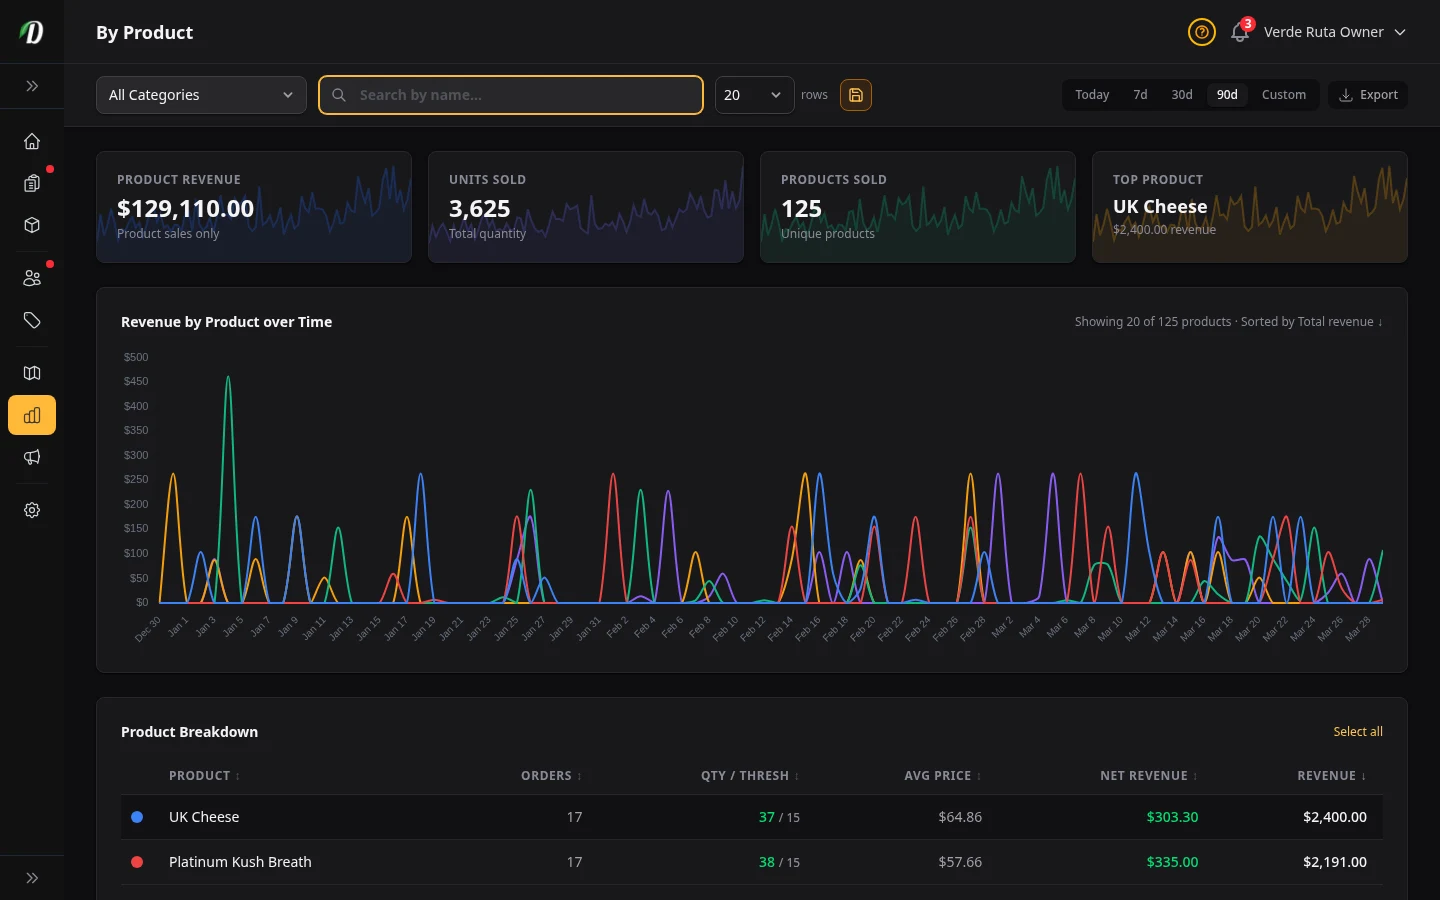
Overview
The By Product report ranks every product by revenue for the selected date range. Use it to identify your best sellers, spot slow movers, and monitor stock levels without leaving the analytics page.
The table doubles as an interactive chart legend — click any product row to toggle its visibility on the trend chart above.
Stat Cards
- Product Revenue
- Total revenue from product sales only (excludes delivery and service fees).
- Units Sold
- Total quantity of items sold across all products in the period.
- Products Sold
- Count of unique products that appeared in at least one order.
- Top Product
- Your highest-revenue product with its total and a sparkline trend.
Interactive Product Chart
The trend chart shows per-product revenue over time. The first five products are shown by default; others are hidden to keep the chart readable.
- Click a product row in the table to toggle its line on the chart.
- Each product gets a unique colour dot that matches its chart line.
- Use Select All / Deselect All to control all products at once.
Product Table
Click any column header to sort ascending or descending. Use the search bar to find a specific product and the category dropdown to filter by category.
- Orders
- How many distinct orders included this product.
- QTY / Threshold
- Current stock quantity alongside the low-stock threshold (e.g. 123 / 50). Colour-coded: green when stock is healthy, yellow at the threshold, and red when below threshold.
- Avg Price
- Average selling price per unit across the period. Hidden on smaller screens.
- Net Revenue
- Revenue minus cost of goods sold. Products without a cost price show zero. Hidden on smaller screens.
- Revenue
- Total revenue generated by this product across all orders in the period.
Tips
- Check the By Product report weekly to identify which items are slow-moving — consider running a promotion or reducing order quantities on the next purchase.
- Sort by QTY/Threshold to find best sellers that are running low on stock before they run out.
- Enter cost prices on all products so the Net Revenue column can show true product-level profit.
- Use the search bar to compare two or three products side-by-side on the chart by toggling only those rows.
Frequently Asked Questions
How do I see which products are selling best in DabDash?
Open Analytics and click the By Product tab. Products are ranked by revenue by default. You can sort by units sold, order count, average unit price, or net revenue. A chart at the top shows each product's revenue trend over time.
What does the QTY/Threshold column mean in DabDash product analytics?
The QTY/Threshold column shows current stock quantity alongside the low-stock threshold (e.g. 123/50). The number is color-coded: green when stock is healthy, yellow when stock equals the threshold, and red when stock is below the threshold. This lets you spot low-stock best sellers without leaving analytics.
Can I see net revenue per product in DabDash?
Yes — the By Product report includes a Net Revenue column showing revenue minus cost of goods sold for each product. Products without a cost price set show zero net revenue. Set cost prices in your pricing structures for accurate per-product profit data.
How does the interactive product chart work in DabDash analytics?
Click any product row in the table to toggle its visibility on the chart. The first five products are shown by default. Use Select All / Deselect All to control all products at once. Each product gets a unique color dot matching its chart line.