Profitability & COGS
Analyze cost of goods sold, gross margins, and net revenue per product to understand true profit.
Overview
The Profitability report shows your true product profit by calculating cost of goods sold (COGS) and gross margins. To use this report, make sure each product has a Cost Price set in its pricing structure.
Products without cost prices appear with zero COGS, which makes margins look artificially high. An amber warning banner at the top tells you how many products are missing cost data.
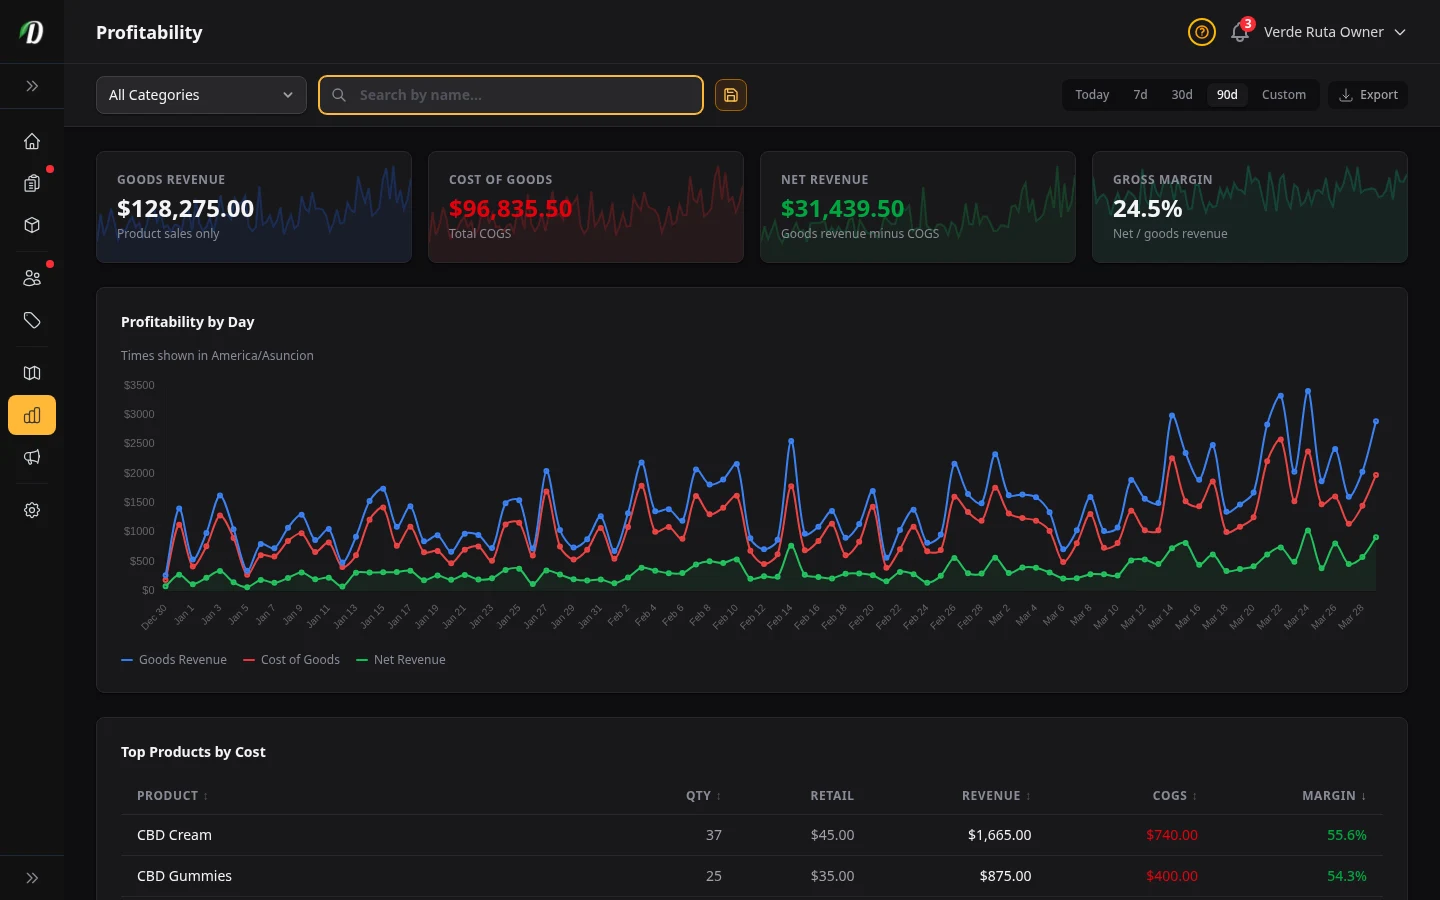
Stat Cards
- Goods Revenue
- Total revenue from product sales only (excludes delivery and service fees). This is the base from which COGS is subtracted.
- Cost of Goods
- Total COGS for the period — units sold multiplied by cost price. Shown in red.
- Net Revenue
- Goods revenue minus cost of goods. The money left over before overheads. Shown in green.
- Gross Margin
- Net revenue as a percentage of goods revenue. A higher percentage means more of each dollar stays with your business.
Profitability Chart
A three-series line chart shows Goods Revenue (blue), Cost of Goods (red), and Net Revenue (green, filled area) over the selected period. Watch for the red and blue lines converging — that means margins are shrinking.
Top Products by Cost
The sortable table below the chart shows each product with its revenue, COGS, and margin percentage. Click column headers to sort.
- Product
- Product name.
- Qty
- Units sold in the period. Hidden on mobile.
- Retail
- Average retail price per unit. Hidden on medium screens.
- Revenue
- Total revenue from this product.
- COGS
- Total cost of goods sold for this product. Shown in red.
- Margin %
- Gross profit as a percentage of revenue. Colour-coded: green for 50% or higher, amber for 25–49%, and red for below 25%.
Cost by Day
A separate daily breakdown table shows each day with gross revenue, COGS (in red), and net revenue (in green). Use this alongside the chart to identify specific days where margins were unusually low — this often points to heavy sales of low-margin products on that day.
Tips
- Enter cost prices on all products so the Profitability report can show true profit. Without them, COGS is zero and margins appear 100%.
- Products with margins below 25% (red) may need a price increase or a cheaper supplier.
- Use the category filter to compare margin health across product types — flower vs. edibles vs. accessories.
- Review this report monthly to catch margin erosion before it impacts your bottom line.
Frequently Asked Questions
How do I check profit margin in DabDash?
Go to Analytics → Profitability tab. DabDash calculates cost of goods sold and gross margin using the cost prices set in your pricing structures. Four stat cards show Goods Revenue, Cost of Goods, Net Revenue, and Gross Margin percentage. A chart plots all three financial metrics over time.
Why does the DabDash COGS report show zero cost?
COGS shows zero when products do not have cost prices set. Edit your pricing structures and enter the wholesale cost per gram or per unit for each tier. Once cost prices are saved, the Profitability report calculates accurate cost of goods sold and margin data.
What do the margin percentage colors mean in DabDash?
Margin percentages are color-coded: green for margins of 50% or higher, amber for 25% to 49%, and red for margins below 25%. This helps you instantly identify products with thin margins that may need a price adjustment or a cheaper supplier.
How is gross margin calculated in DabDash?
Gross margin is calculated as (Revenue minus Cost of Goods Sold) divided by Revenue, expressed as a percentage. Revenue is the total customers paid for products. COGS is units sold multiplied by the cost price you set in pricing structures.