Revenue by Zone
Compare delivery zone performance by revenue, order volume, and delivery fees collected.
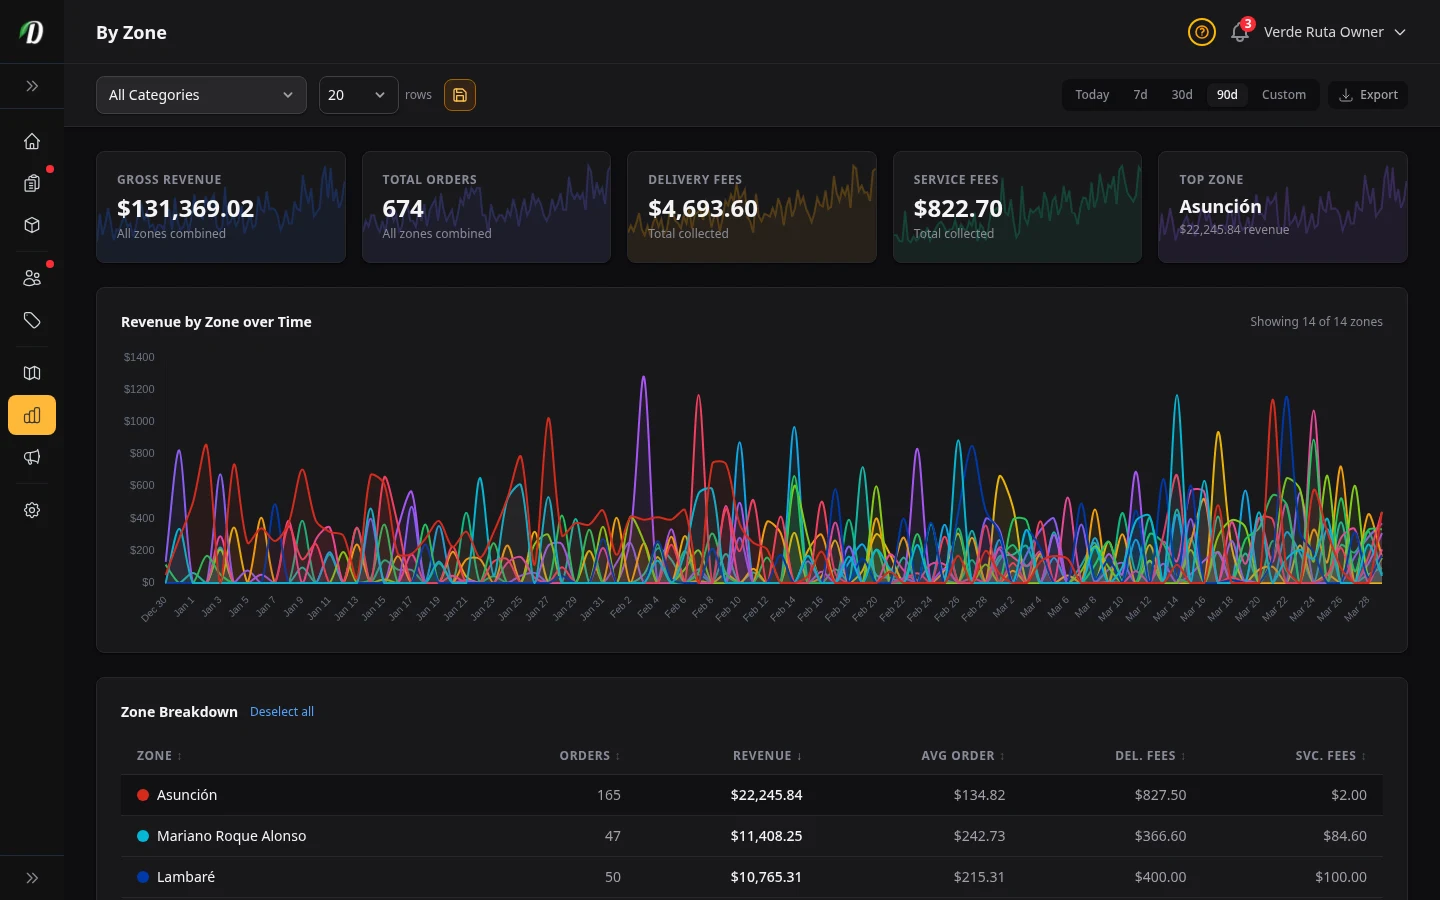
Overview
The By Zone report shows which delivery zones are generating the most revenue and order volume. Use it to identify high-value areas for marketing, measure zone-level delivery fee income, or decide whether a low-performing zone is worth keeping active.
The stat cards at the top update reactively based on which zones you have selected in the table below.
Stat Cards
- Gross Revenue
- Total product sales plus delivery fees across all selected zones.
- Total Orders
- Number of orders placed in the selected zones during the period.
- Delivery Fees
- Total delivery fees collected across selected zones.
- Service Fees
- Total service fees collected across selected zones.
- Top Zone
- Your highest-revenue zone with its total and a sparkline trend.
Zone Revenue Chart
The area chart visualizes per-zone revenue over time with filled regions so you can see each zone's contribution to total revenue. Click zone rows in the table to toggle their visibility on the chart.
Your zone selections are saved in your browser between visits so the chart remembers which zones you were focused on.
Zone Detection Activity
The Zone Detection Activity card shows how well your zone coverage matches customer demand:
- Attempts
- Total number of address lookups performed when customers entered delivery addresses.
- Successful Detections
- How many lookups successfully matched a delivery zone.
- Success Rate
- Percentage of successful detections. A low rate means customers are trying to order from areas outside your delivery zones.
- By Method
- Breakdown of detection methods: GPS geolocation, address lookup, or manual zone selection.
Zone Breakdown Table
Click any column header to sort. Each zone row shows a colour dot matching its chart area. The No Zone row (shown with a ring instead of a filled dot) captures orders from addresses outside your delivery zones.
- Zone Name
- The name you gave this delivery zone in zone settings.
- Orders
- Number of orders delivered to this zone.
- Revenue
- Total revenue from this zone.
- Avg Order Value
- Average order total for this zone. Hidden on smaller screens.
- Delivery Fees
- Total delivery fees collected from this zone. Hidden on smaller screens.
- Service Fees
- Total service fees collected from this zone. Hidden on smaller screens.
Tips
- A high No Zone order count means you have demand in areas you are not currently covering. Consider expanding your delivery zones to capture this revenue.
- Compare delivery fee income across zones — if a farther zone generates high revenue but low delivery fees, consider adjusting the fee to cover driver costs.
- Low-performing zones with few orders may not justify the delivery overhead. Use the 90-day range to confirm the trend before deactivating.
- Check the zone detection success rate — if it is below 80%, your zone polygons may not cover common customer addresses accurately.
Frequently Asked Questions
How do I compare delivery zone performance in DabDash?
Open Analytics and click the By Zone tab. Each zone shows its total revenue, order count, average order value, delivery fees, and service fees. An area chart visualizes zone revenue over time. Click zone rows to toggle their chart visibility.
What is the zone detection activity card in DabDash?
The Zone Detection Activity card shows how many address lookups were attempted, how many matched a delivery zone, the success rate percentage, and a breakdown by detection method (GPS, address, manual). This helps you understand how well your zone coverage matches customer demand.
What does No Zone mean in DabDash zone analytics?
Orders labeled No Zone came from customers whose delivery address did not fall inside any of your drawn delivery zones. A high No Zone count means you have demand in areas you are not currently covering. Consider expanding your zones to capture this revenue.