Search SEO MAX
Track search clicks, impressions, click-through rate, and average position with Google Search Console data.
Overview
The SEO Performance report pulls data from Google Search Console to show how your storefront is performing in Google search results. You must connect Google Search Console in Settings → Integrations before this report displays data.
Google Search Console data typically has a 2-3 day delay. This is a Google limitation, not a DabDash issue. Use the 30-day or 90-day range for more meaningful trend analysis.
Prerequisites
Before you can use the SEO Performance report:
- Go to Settings → Integrations
- Connect your Google Search Console account
- Select the property that matches your store domain (your DabDash subdomain or custom domain)
- Wait 24-48 hours for initial data to populate
If Search Console is not connected, the report shows a prompt to complete the setup. If your store is brand new, Search Console may take a few weeks to gather meaningful data.
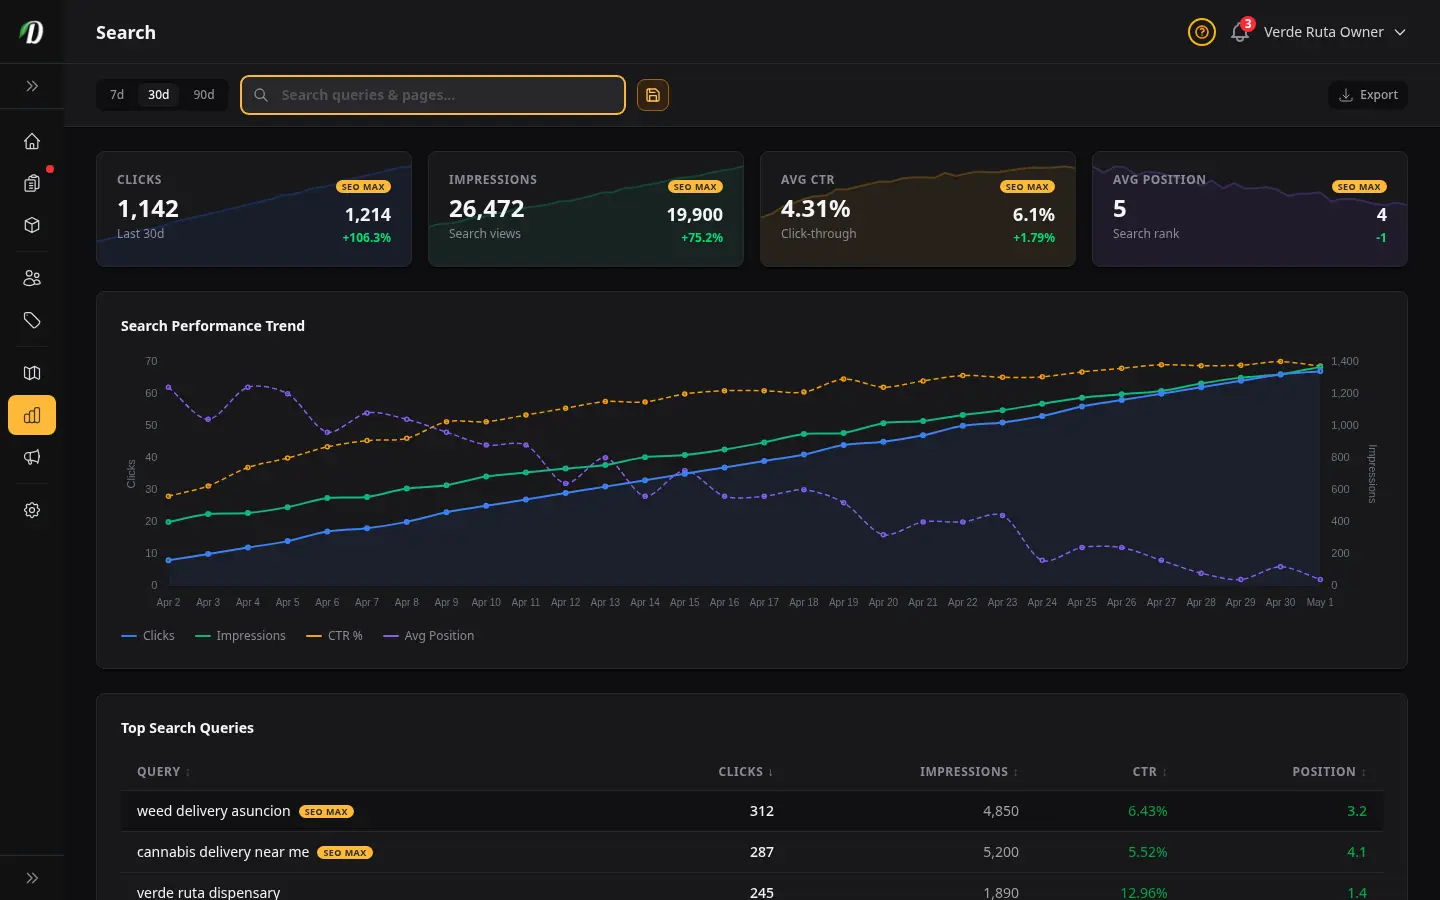
Stat Cards
- Clicks
- Number of times someone clicked through from Google to your storefront. If SEO MAX is active, a comparison percentage shows the improvement.
- Impressions
- How many times your pages appeared in Google search results, even if not clicked.
- Avg CTR
- Click-through rate — clicks divided by impressions, as a percentage. Higher CTR means your titles and descriptions are compelling.
- Avg Position
- Your average ranking position in Google results. Lower is better — position 1 means top of page one.
Search Performance Chart
The chart shows four toggleable metrics over time: Clicks, Impressions, CTR %, and Avg Position. Click legend items to show or hide individual metrics. CTR and Position use dashed lines to differentiate from volume metrics.
Top Search Queries
The sortable table shows which search terms are driving traffic to your store. Click column headers to sort by clicks, impressions, CTR, or position.
- Query
- The search term people typed into Google. If SEO MAX is targeting this keyword, an amber badge is shown.
- Clicks
- How many times someone clicked your listing for this search term.
- Impressions
- How many times your listing appeared for this search term. Hidden on mobile.
- CTR
- Click-through rate for this specific query. Hidden on medium screens.
- Position
- Average ranking position for this query. Lower is better.
SEO MAX
SEO MAX is a premium feature that automatically generates optimized blog content targeting high-value cannabis keywords for your location.
- Keywords actively targeted by SEO MAX show an amber badge in the queries table.
- Previously targeted keywords (now inactive) show a gray badge.
- Stat cards show comparison percentages so you can measure the SEO MAX impact on clicks, impressions, and position.
If you do not have SEO MAX, the report still works with standard Google Search Console data — the comparison badges and keyword targeting indicators are simply hidden.
Tips
- Focus on queries with high impressions but low clicks — these are opportunities to improve your meta titles and descriptions to boost CTR.
- Track your average position over time using the 90-day range. Consistent improvement means your SEO efforts are working.
- New stores may take 4-8 weeks to see meaningful search data. Keep publishing content and optimizing product pages.
- Use the SEO Settings page to ensure every page has a unique meta title and description — Google rewards unique, descriptive metadata.
Frequently Asked Questions
How do I track search engine performance in DabDash?
Open Analytics and click the SEO tab. Connect your Google Search Console account in Settings → Integrations. The SEO report then shows clicks, impressions, click-through rate, and average search position for your storefront pages over the selected date range.
What is DabDash SEO MAX?
SEO MAX is a premium feature that automatically generates optimized blog content targeting high-value cannabis keywords for your location. The SEO report shows which keywords are being targeted with amber SEO MAX badges and compares performance metrics before and after optimization.
Why is DabDash SEO data delayed by a few days?
Google Search Console data typically has a 2-3 day delay. This is a Google limitation, not a DabDash issue. The SEO report shows the most recent data available from Google. Use the 30-day or 90-day range for more meaningful trend analysis.